Analyze DevOps Metrics With eazyBI
Just recently, eazyBI has released a couple of new versions—eazyBI 5.1 and eazyBI 5.2. Among many features and improvements, eazyBI is also jumping into the exciting cross-team analysis by adding a standard data import from Atlassian’s DevOps tools—Bitbucket and Bamboo.
Why Have DevOps Concepts Risen to Such a Glory?
In the last few decades, the markets are changing with increasing speed. If you are not fast enough to grab new opportunities and agile enough to adapt to new situations, the competition might get your spotlight in no time. With this, the requirements of the supporting software have also become extremely dynamic. While I do not wish to compare waterfall methods that used to work some time ago (and might still work in some environments), it is clear why Agile software development gained popularity. Today software development wants to be as reactive to customer needs as possible. Yet, it is also surfacing that for a company to be Agile no longer means for the development team to interact with the customer on a regular bases. To be faster than the competitor, the whole process of continuous delivery becomes essential. For this reason, DevOps gain more and more support as various teams in Agile companies work together for the common goal of getting the customer needs from an idea to put in use in production.
Why Talk About DevOps in eazyBI, a Data Analysis Tool?
At eazyBI, we love to talk about metrics, but when looking at DevOps ideas, metrics play an important role too. If you do wish to be fast, improve your processes, find your flaws and get ahead of yourself (and, more importantly, your competitors), you need to measure and analyze how teams are working and cooperating. To know if introduced DevOps procedures have increased your efficiency, you need to analyze and compare it with how it was yesterday. The scientific method mantra of "Build. Measure. Learn." is very relevant to the DevOps concepts. We at eazyBI are happy to jump on the DevOps train and add an import of Atlassian Bitbucket pull request and Bamboo build and deploy data to existing Jira issues cube in the eazyBI Jira app. Combining existing data with the new insights from the development and deployment process will make it possible to Measure, Learn and Improve your DevOps processes and team cooperation, finally reaching the common goal of fast collaboration and quality product operations.
Main DevOps Metrics in eazyBI
There are several main metrics in which organizations using or introducing DevOps are interested in.
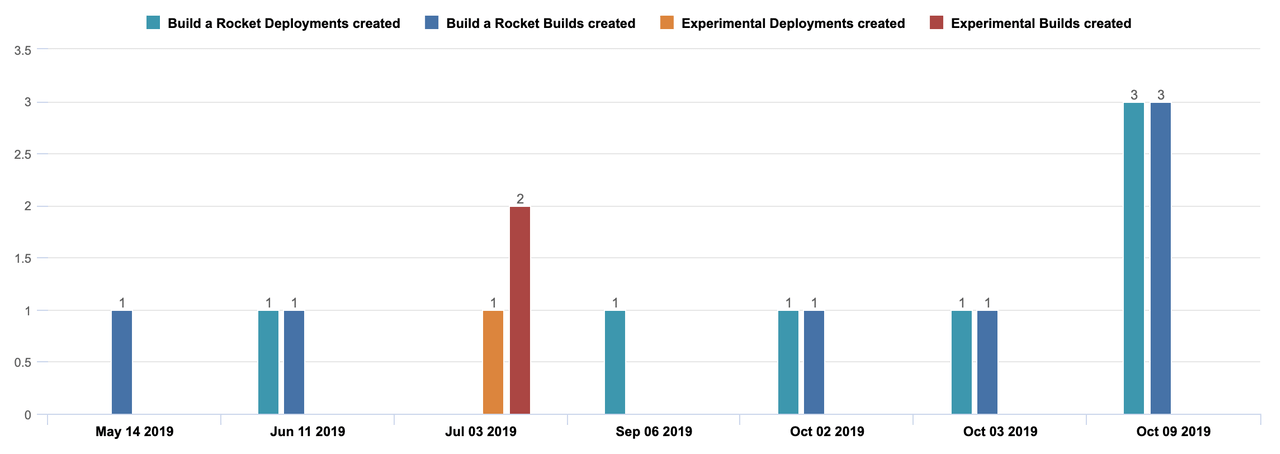
Deployment Frequency. Deployment to production is the moment when the paying customer gets to start using the features they need in response to market opportunities. Customers are looking to have features available at the right time. As DevOps process maturity grows, the frequency of new version deployment to production should become shorter and shorter. If you have a process that allows deploying new features to production at any time, the responsibility of when to deploy can be removed from IT and give this decision to the business. With eazyBI, you can now display Bamboo Build and Deployment information as well as the frequency on a timeline.
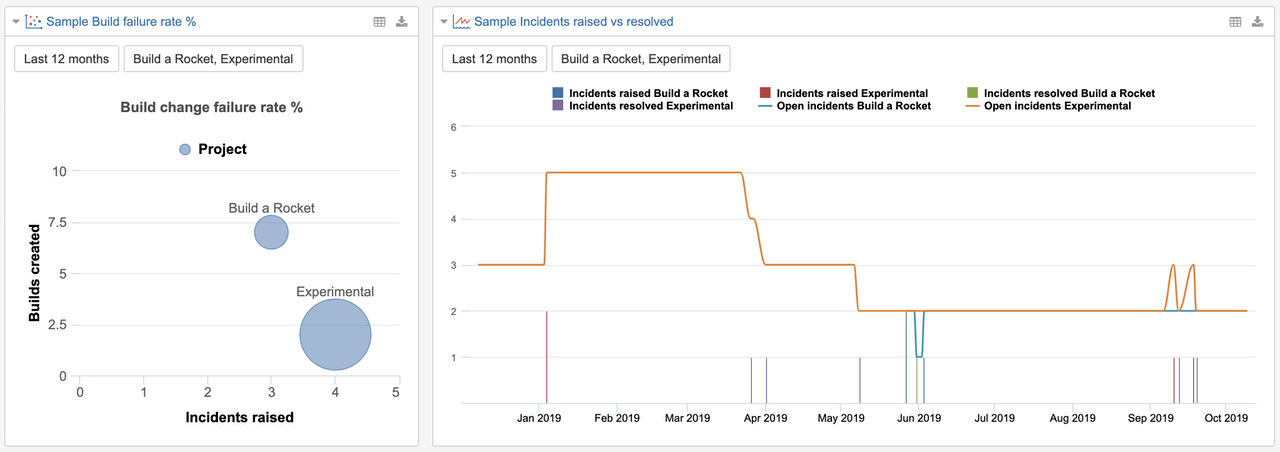
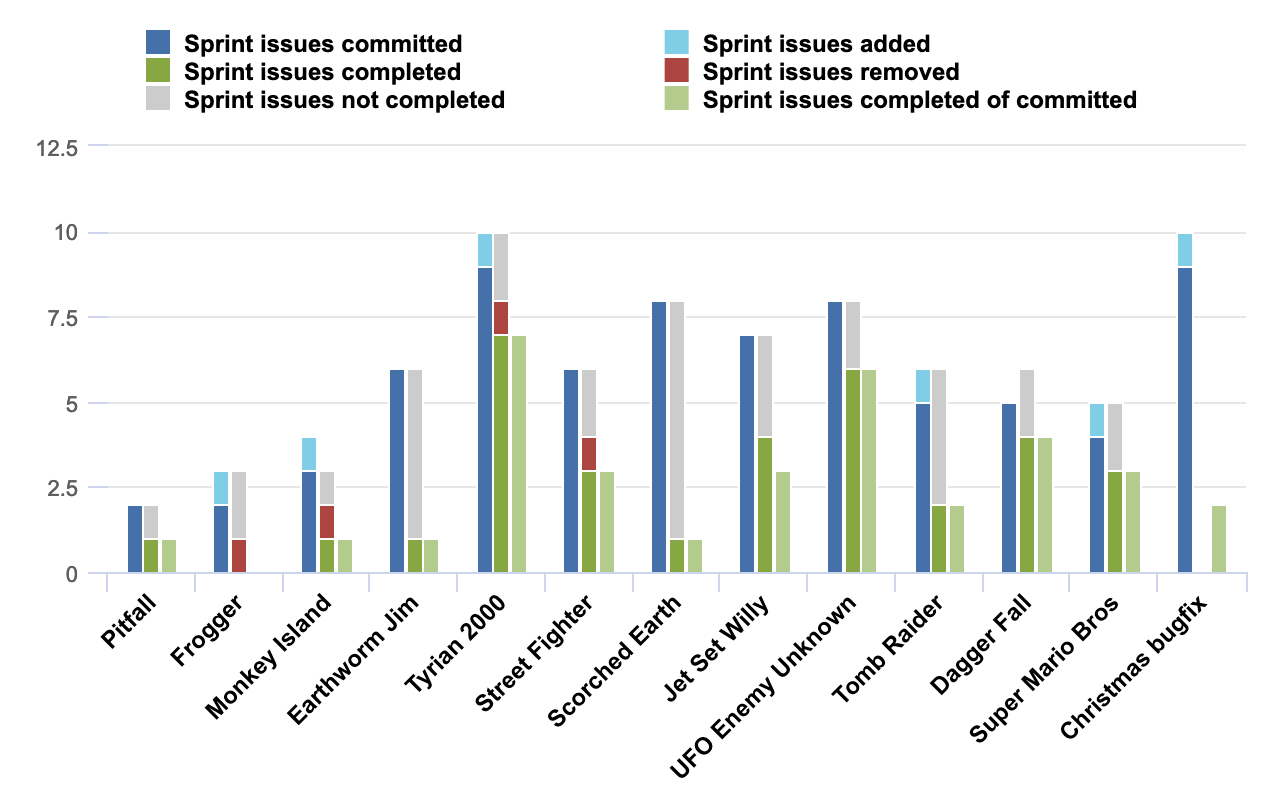
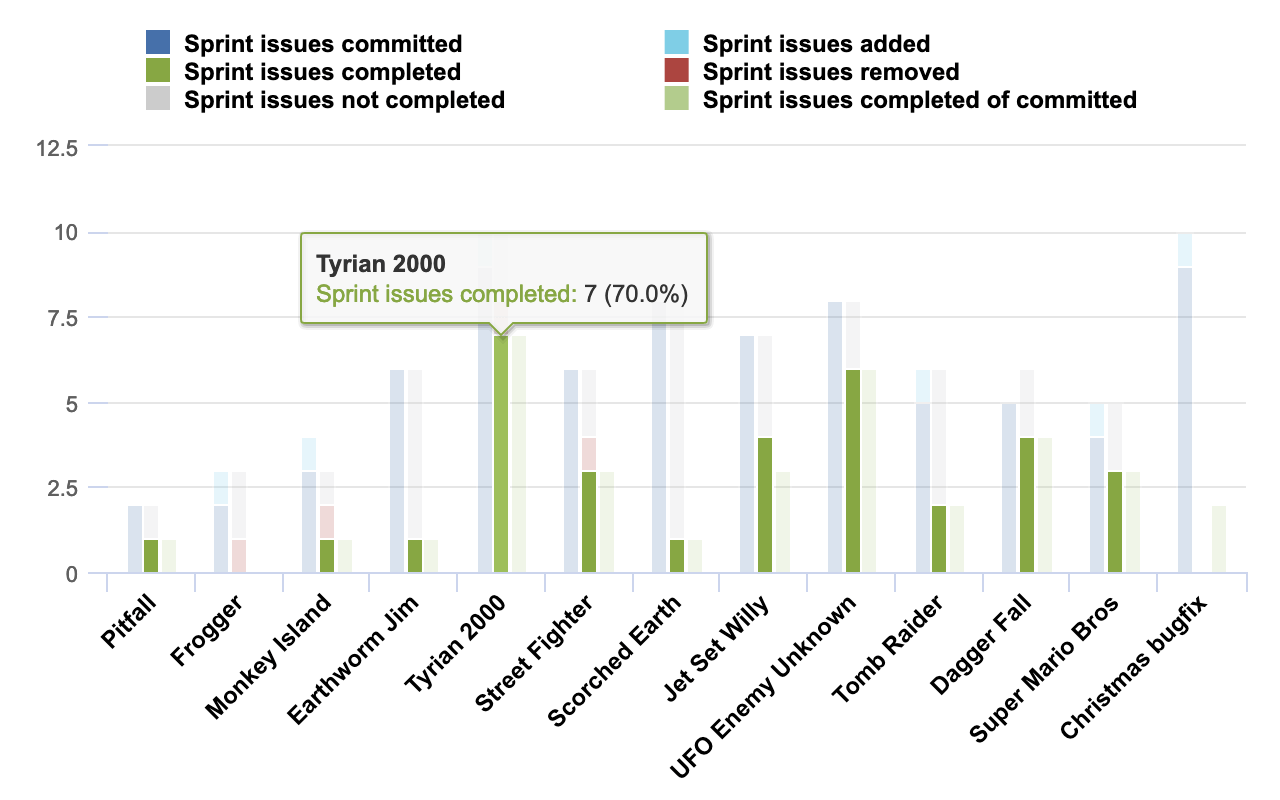
Change Failure Rate. The choice between building software "faster or with high quality" is as old as time. It would be best if we would not need to make this choice. Measuring and analyzing how often bugs in production happen or reappear and how often you encounter issues in the deployment process helps to find solutions and build things with speed and high quality. Incidents raised and resolved report is possible with importing Jira issue created and resolved information. With Bamboo build information, you can now calculate the incident rate per build.
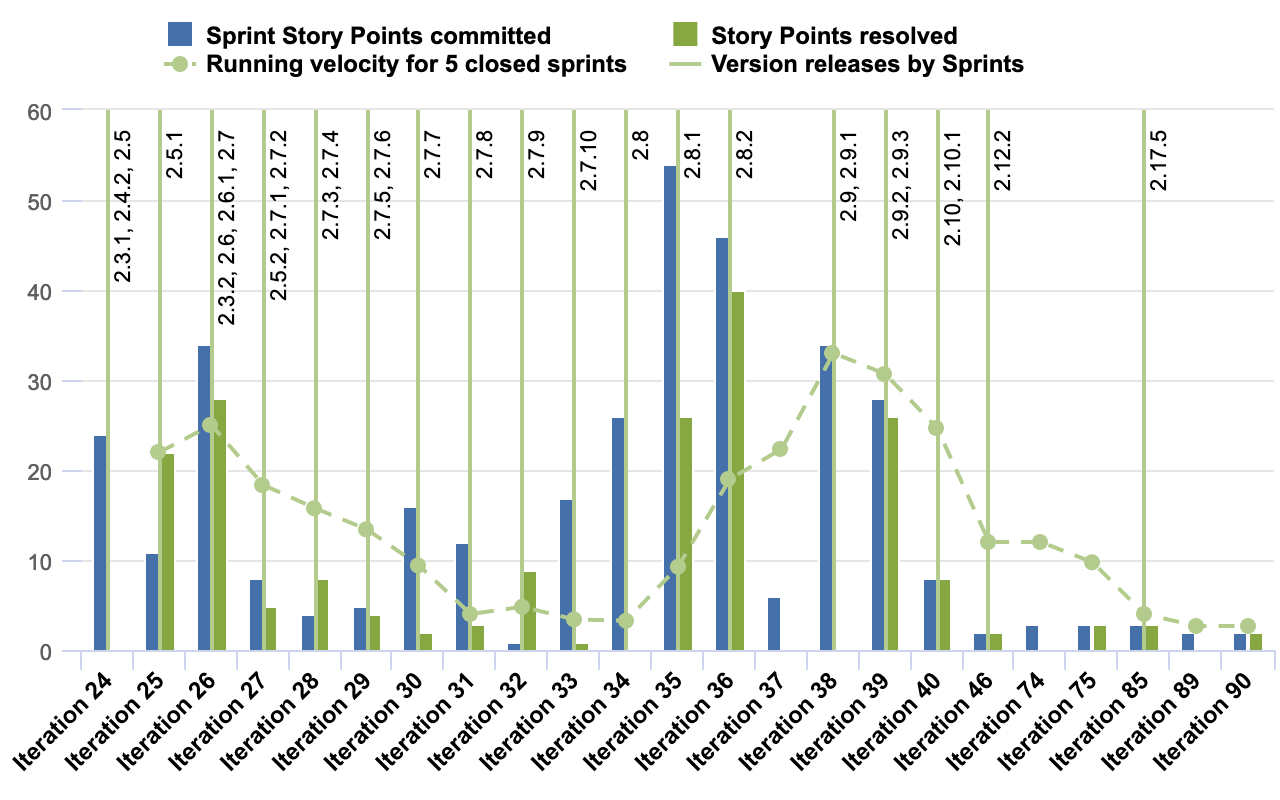
Mean Time to Change and Change Lead Time. When the business sees an opportunity in the market, they wish to react to it as soon as possible. Measuring and shortening the time for an idea to get from "author's mind" to a solution in production means customers can react to market changes and requirements faster. A similar metric is Change Lead Time, which does not include all issue life cycle, but starting from development moment and until delivery to production. Average Resolution days for Change issue types, which would represent the Mean time to change, were available with standard Jira data import. With the import of Bitbucket Pull request development, review, and deploy average times in eazyBI, you can now get detailed information about Change Lead Time.
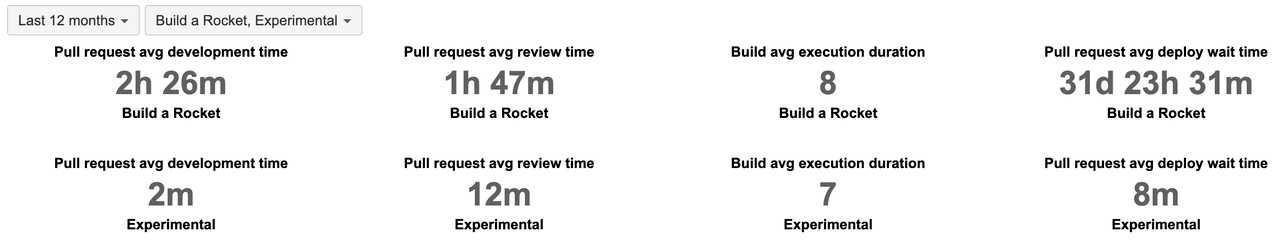
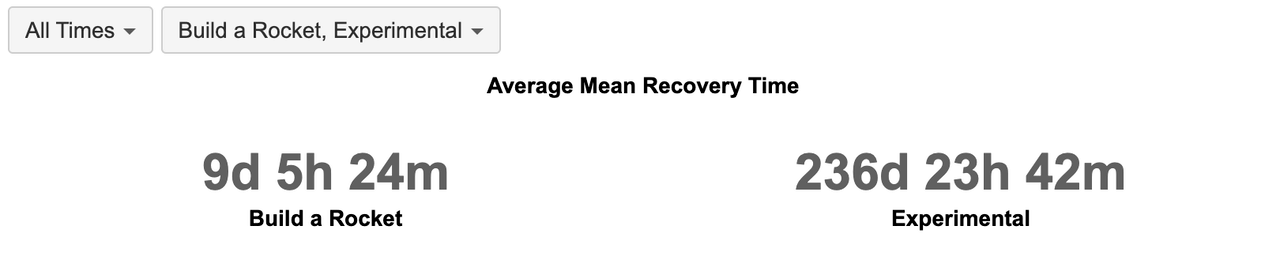
Mean Time to Recovery. No software development has gone without failures. If you prepare that this will also happen to your software, you can get ready to deal with the production downtime. It is beneficial to measure both—frequency and duration of downtimes to know if the DevOps processes are working efficiently. One extended downtime can have a more substantial effect on the customer business than several few-second downtimes. With eazyBI, you can measure Average or Total recovery time with Incident issue types.
Other News in eazyBI 5.1 and eazyBI 5.2
While DevOps is the principal and most exciting new integration added in eazyBI 5.1 version, there are also a few other improvements worth mentioning:
- Specifically, for the dynamic environment of DevOps, we saw that analysis about more than 12 months ago would no longer be valid. To add this filter to DevOps sample reports, we added a predefined member for the last 12 months in the Time dimension. Additionally, there are Current, Previous month, Last 30 days, and Last 4 weeks calculated members you could use in the DevOps or any other report or as an example for your custom period calculated members.
- With eazyBI 5.1, we have upgraded the chart drawing library. In the background, this smashed some chart drawing bugs, but from the user point of view the most visible improvement is the highlight of individual chart series on a mouse hover.
- In the 5.2 version, several enhancements are introduced specifically for the bar chart. The option to add a vertical line as a milestone marker, which previously was available only for the Timeline chart, can now be used in bar charts as well as line charts. Also, we have fixed that higher-level names are displayed in the bar chart if you have drilled into lower levels of some dimension. Lastly, you can now show relative values in the bar chart, making the whole stacked bar as 100%.
Learn more about recent updates in version 5.1 and 5.2 in the eazyBI for Jira Changelog.