
The leading reporting app for Jira
Custom reports, charts, and dashboards inside Jira — with AI help for the people building them, and an interface for the agents automating them.

Why eazyBI for Jira
Jira sources and more
Jira Software, Service Management, Assets and linked issues, plus Tempo, Xray, and other apps.
Historical Jira data
Change history, worklogs, and sprint flow over time — beyond what Jira dashboards show.
Ready-made and custom Jira reports
Cycle time, velocity, SLA, and sprint reports to run and adapt. 100+ sample and demo reports, along with an unlimited number of yours.
Drill through to the issues
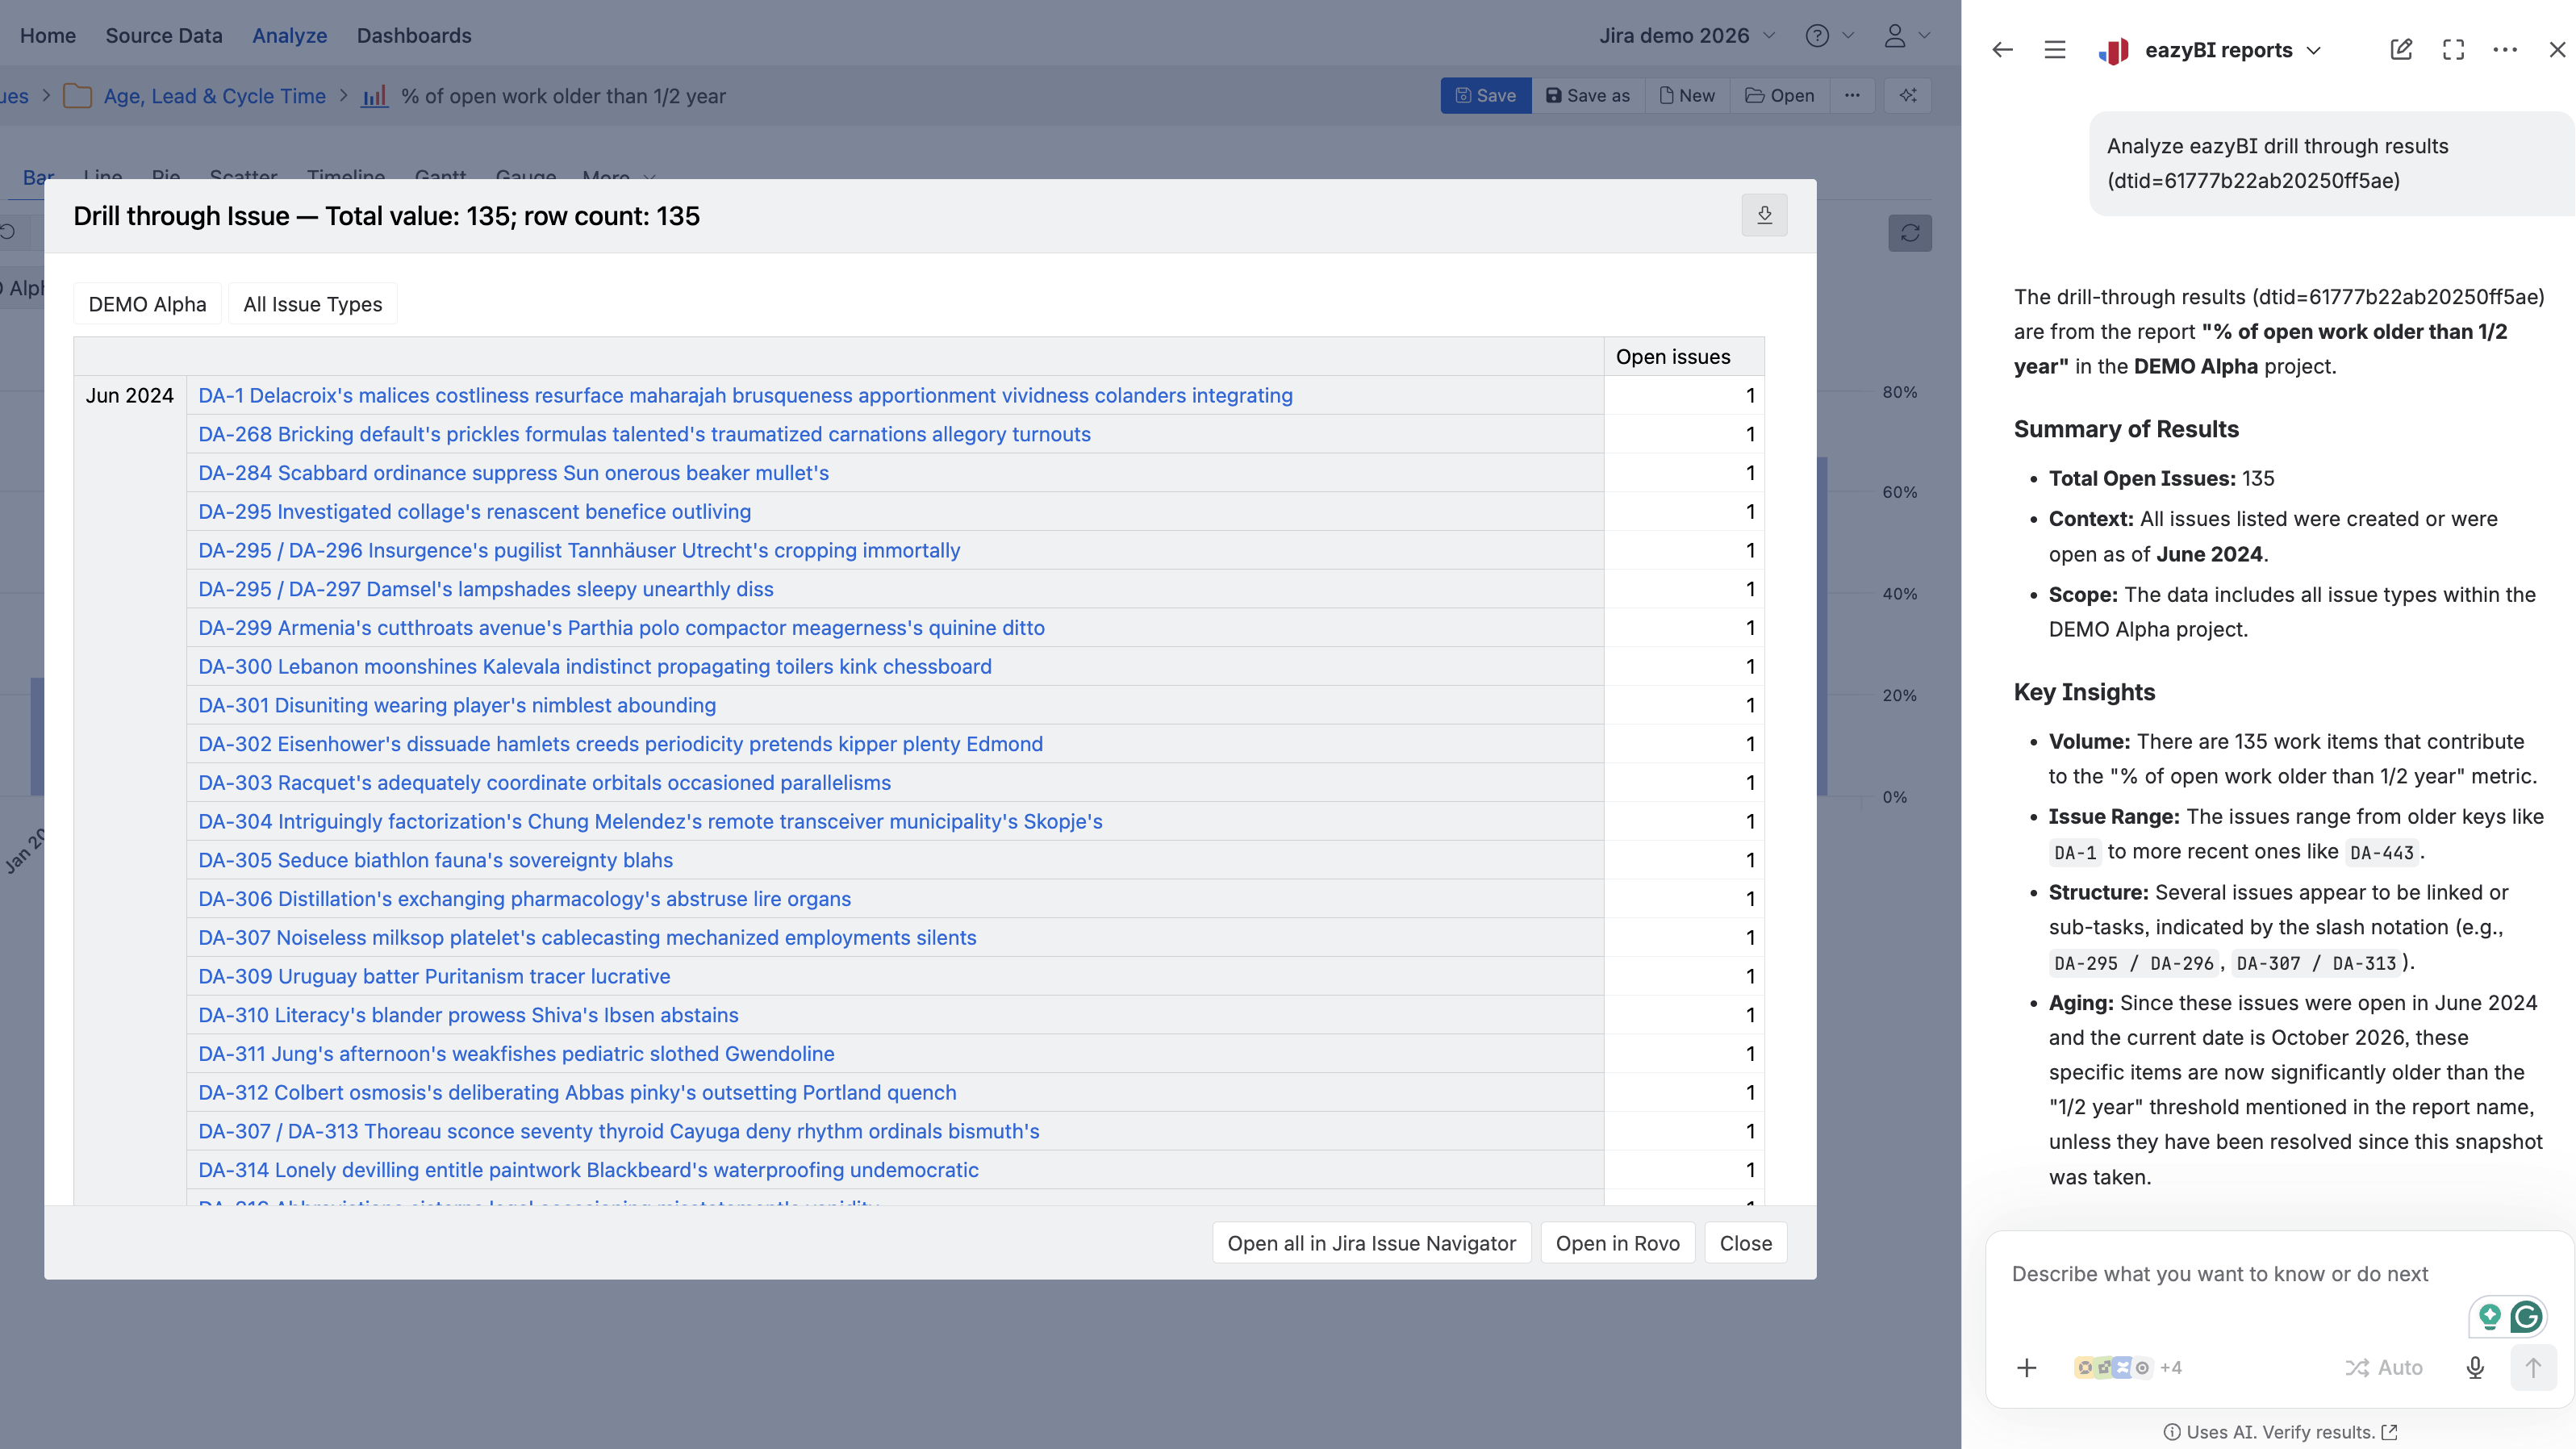
Click any number to the exact Jira issues behind it, and open the issue list in Jira or explore with Rovo.
Publish in Jira and Confluence
Reports on Jira dashboard gadgets, Confluence pages, JSM Customer portal, and iframes.
AI assistants and CLI
Assistants help you build reports and create metrics. The eazyBI CLI lets an agent run your recurring reporting.
Two ways to work
with your Jira data
Work in eazyBI yourself — with AI assistants helping as you go — or hand the repetitive reporting to an agent. Either way, eazyBI calculates every number.

Structure and analyze your data any way you need. eazyBI provides advanced reporting and analysis, to create anything — from simple pivot tables to multi-dimensional reports.
Import all data
From Jira standard and custom fields, current and historical data, and popular marketplace apps to SQL, REST, Excel, Google Sheets, CSV, and more.

Build custom reports
Build detailed pivot tables and custom reports. Drag-and-drop dimensions and measures, filter, sort, drill down or across.
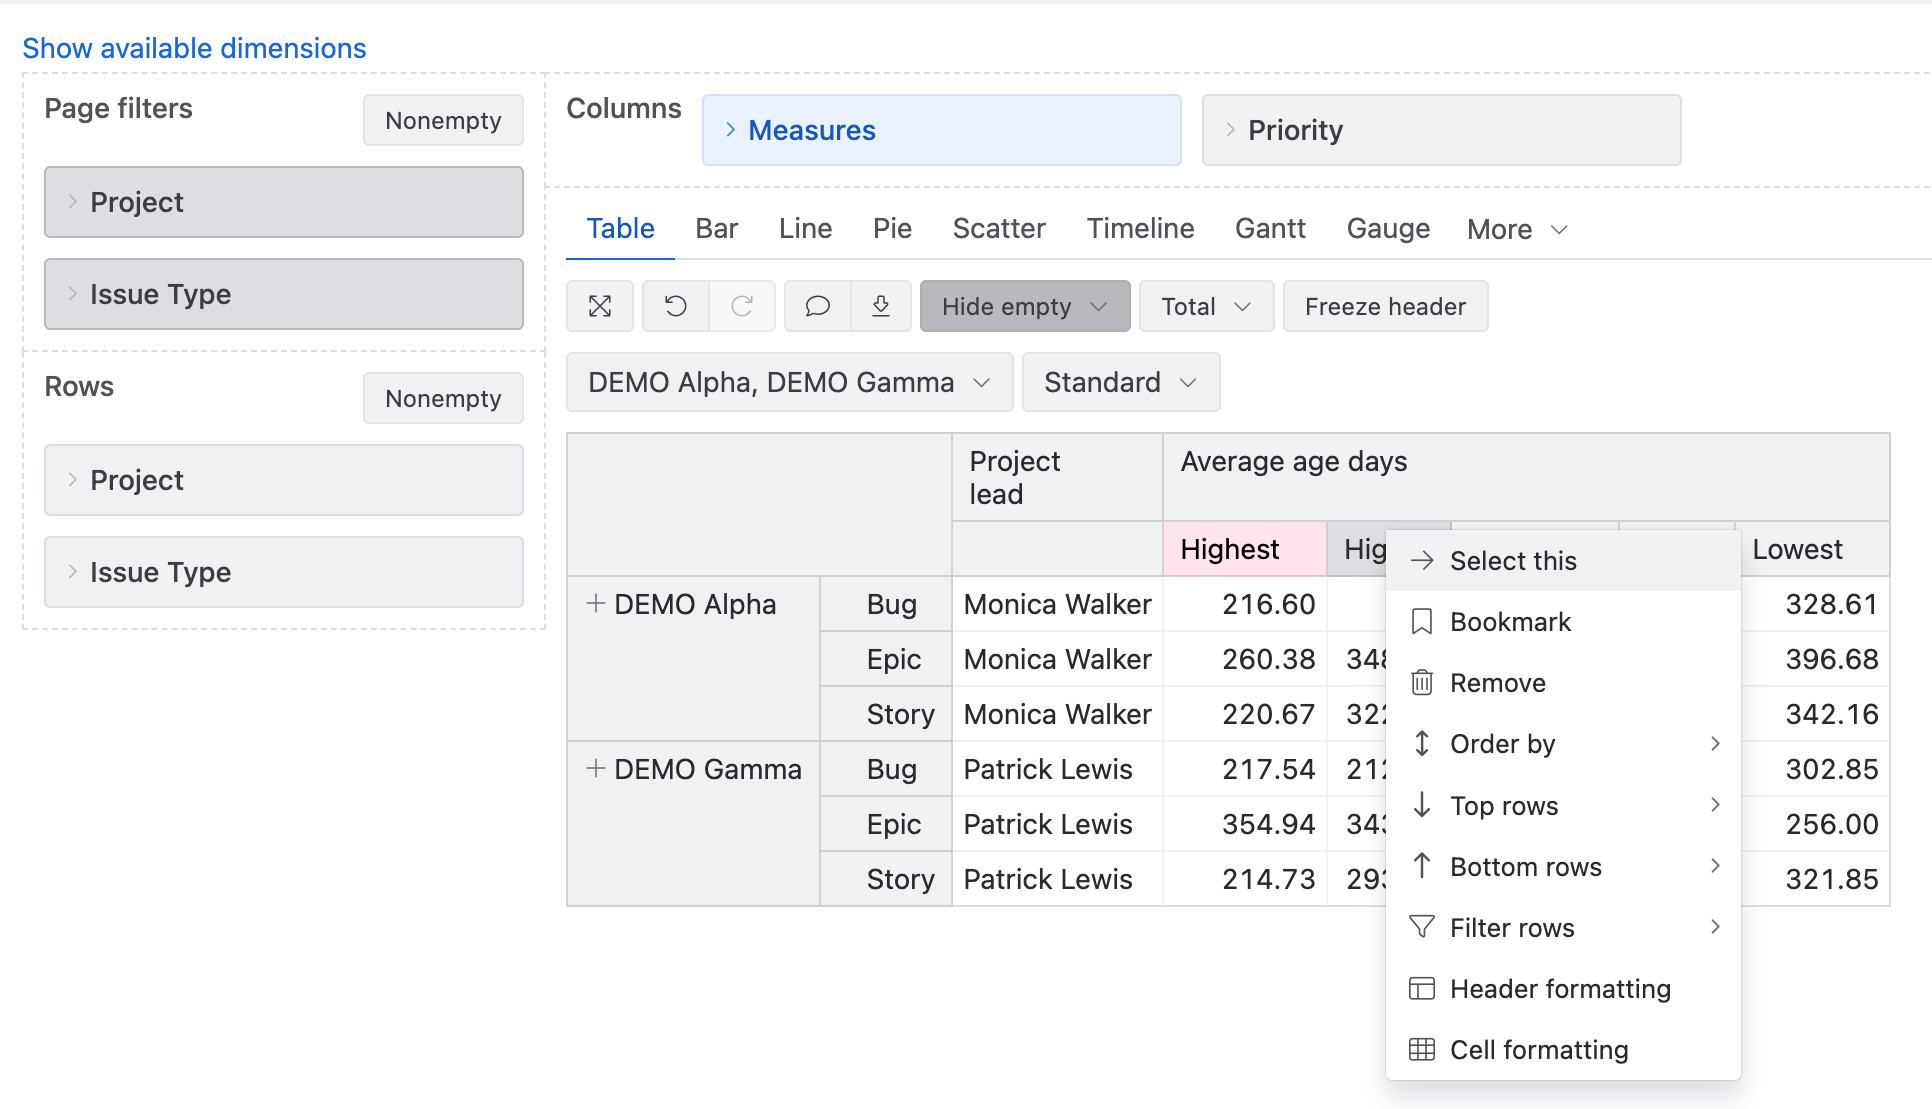
Use standard calculations
Add built-in standard calculations from averages to linear trends and cumulative sums, time comparisons and more.
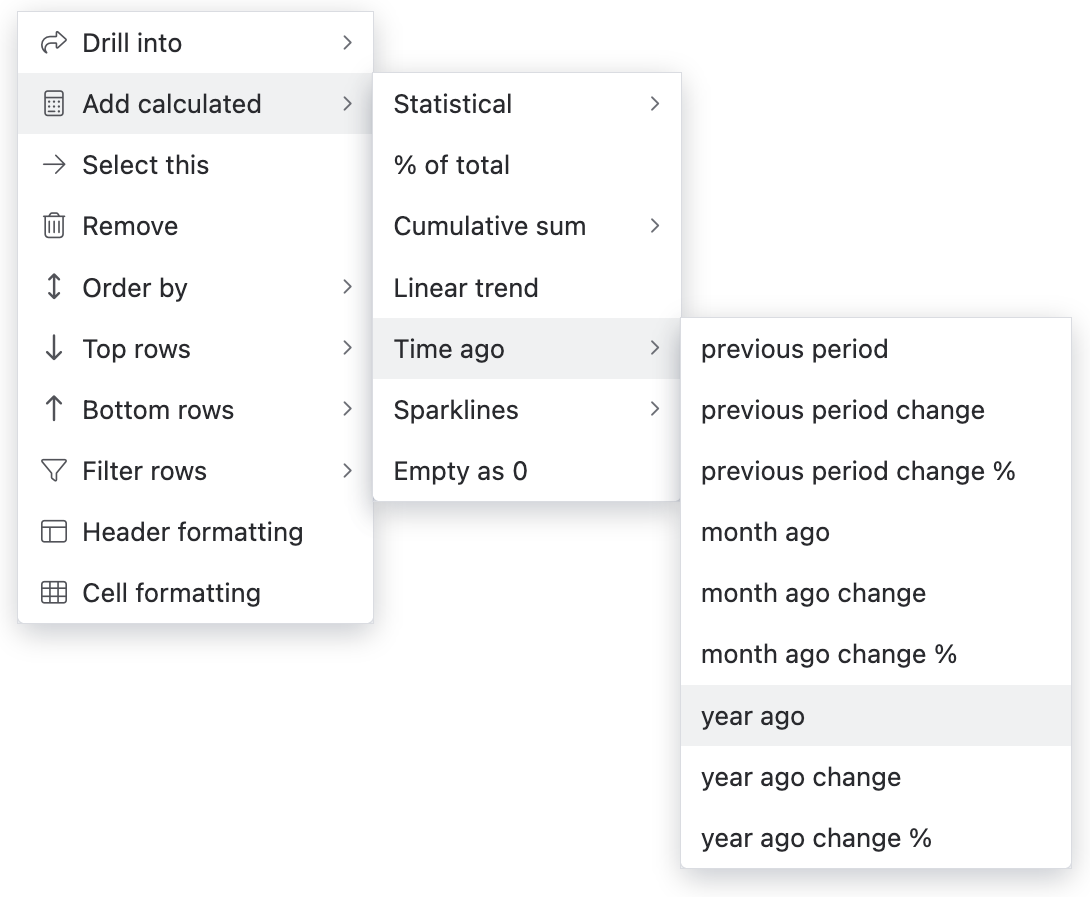
Add custom calculations
Use Jira-specific functions and formulas, or write your own using built-in MDX formula editor.
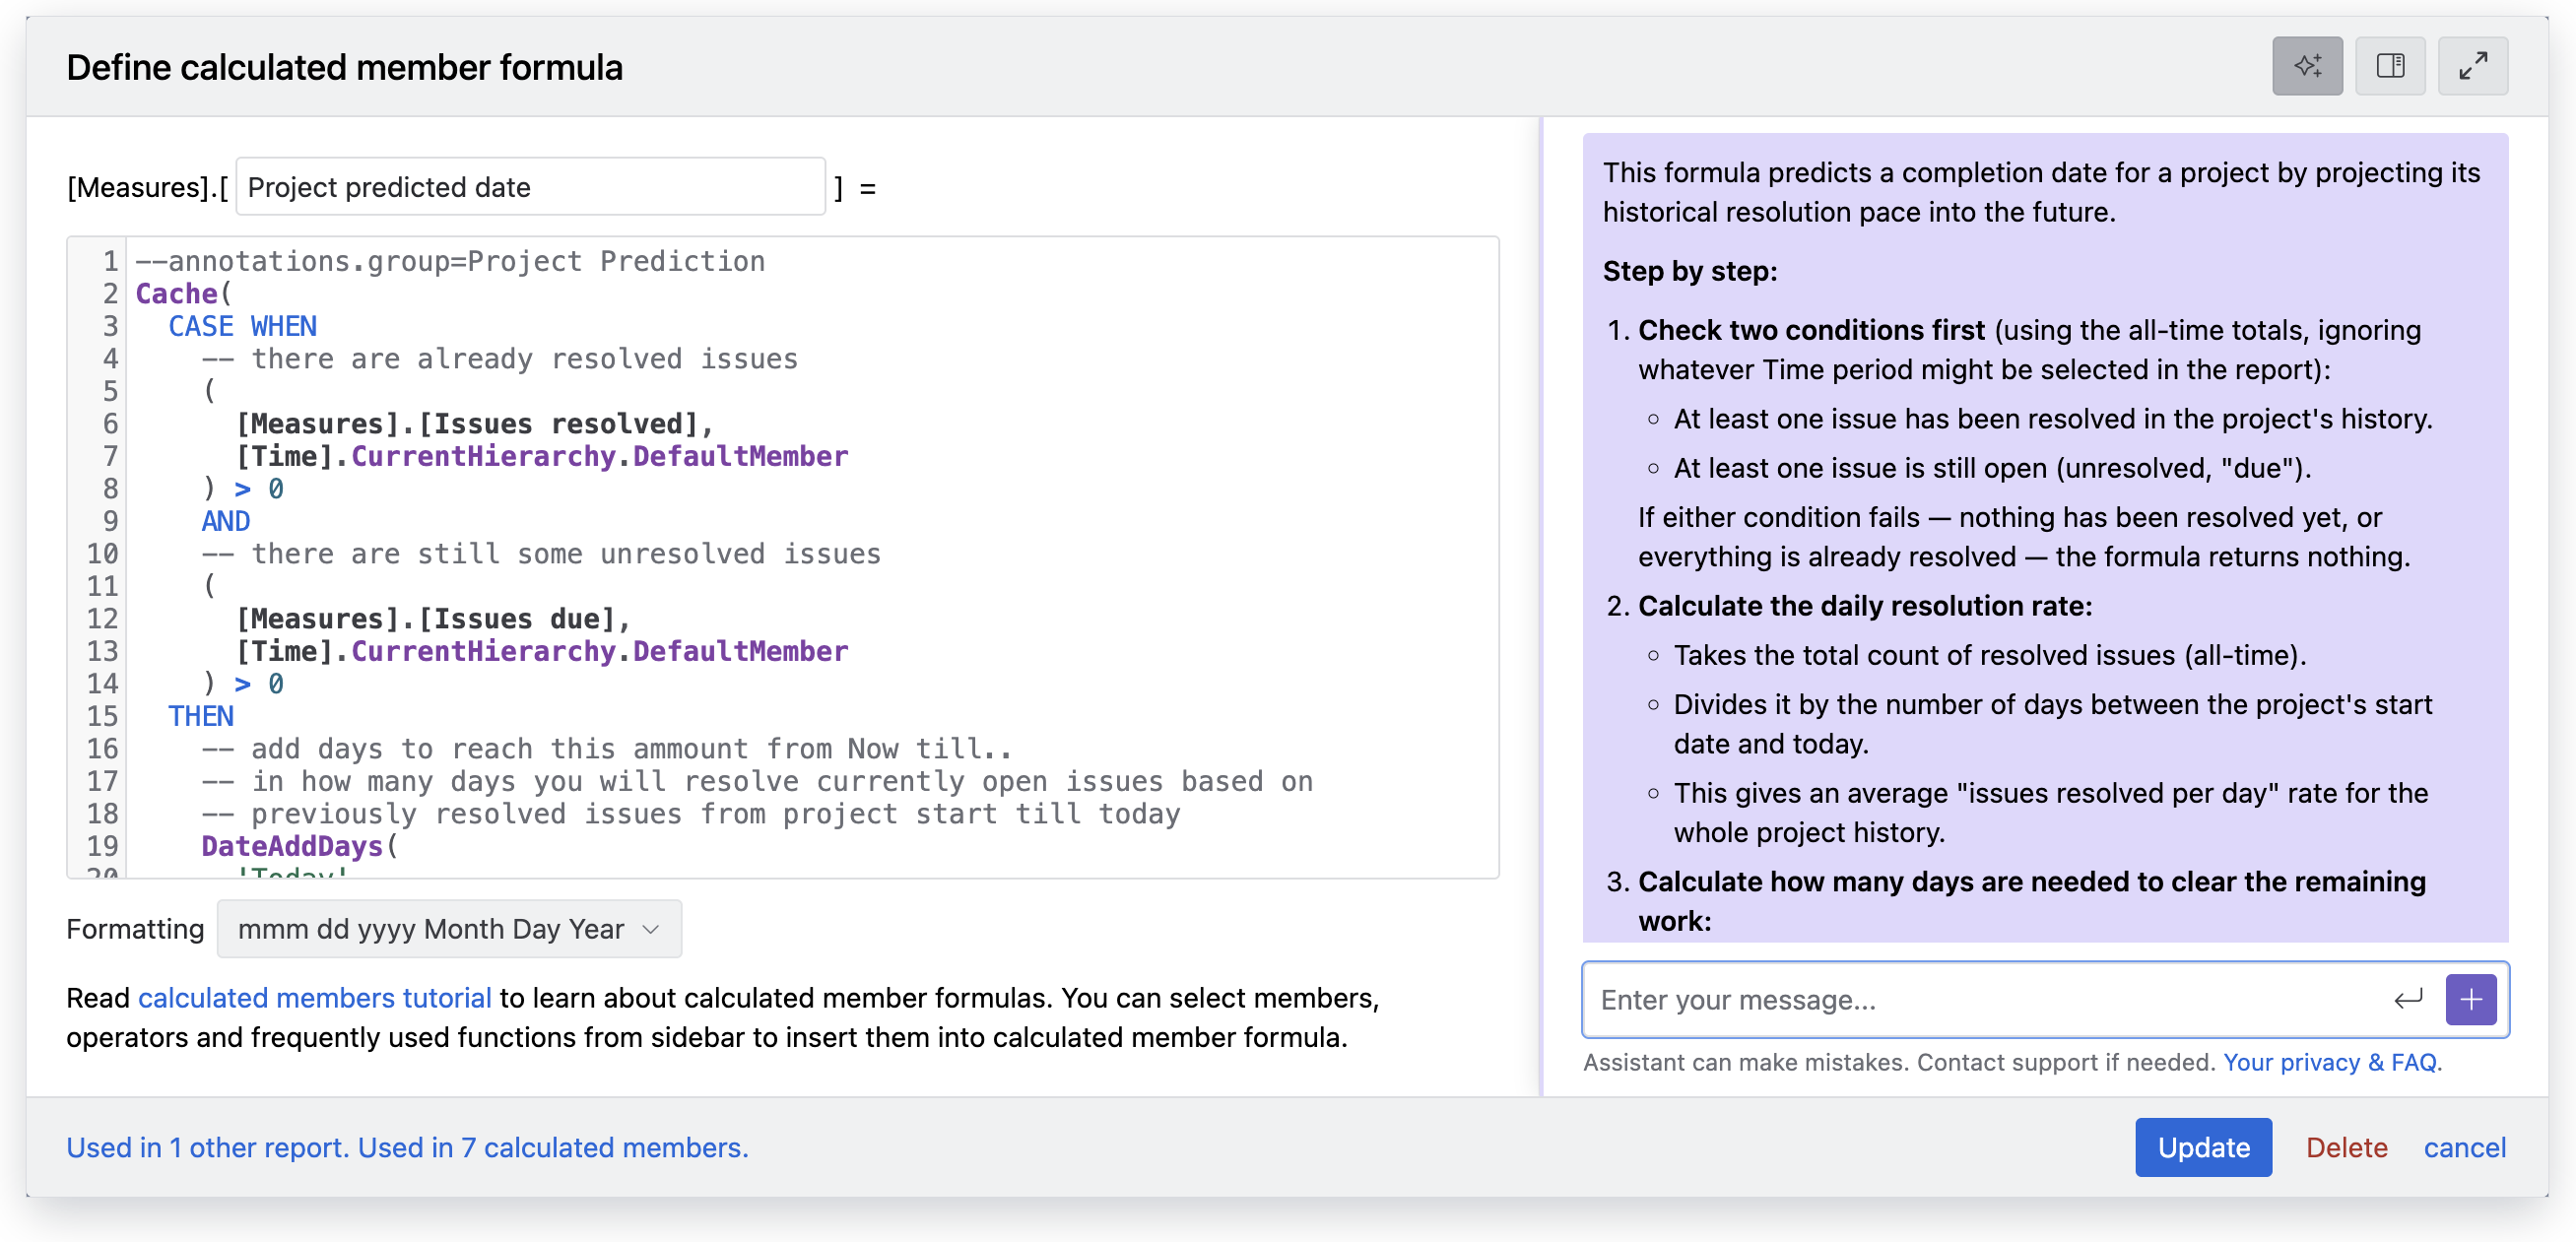
AI-assisted report building
Use the eazyBI AI assistant to write custom MDX, explain functions, define JavaScript import settings, or generate complete reports.


Visualize any data using many customizable charts. Combine charts and reports in interactive dashboards for a comprehensive overview.
Interactive dashboards
Combine reports and charts in a custom dashboard layout. Apply common filters, interact with any chart or report right from the dashboard — anywhere.
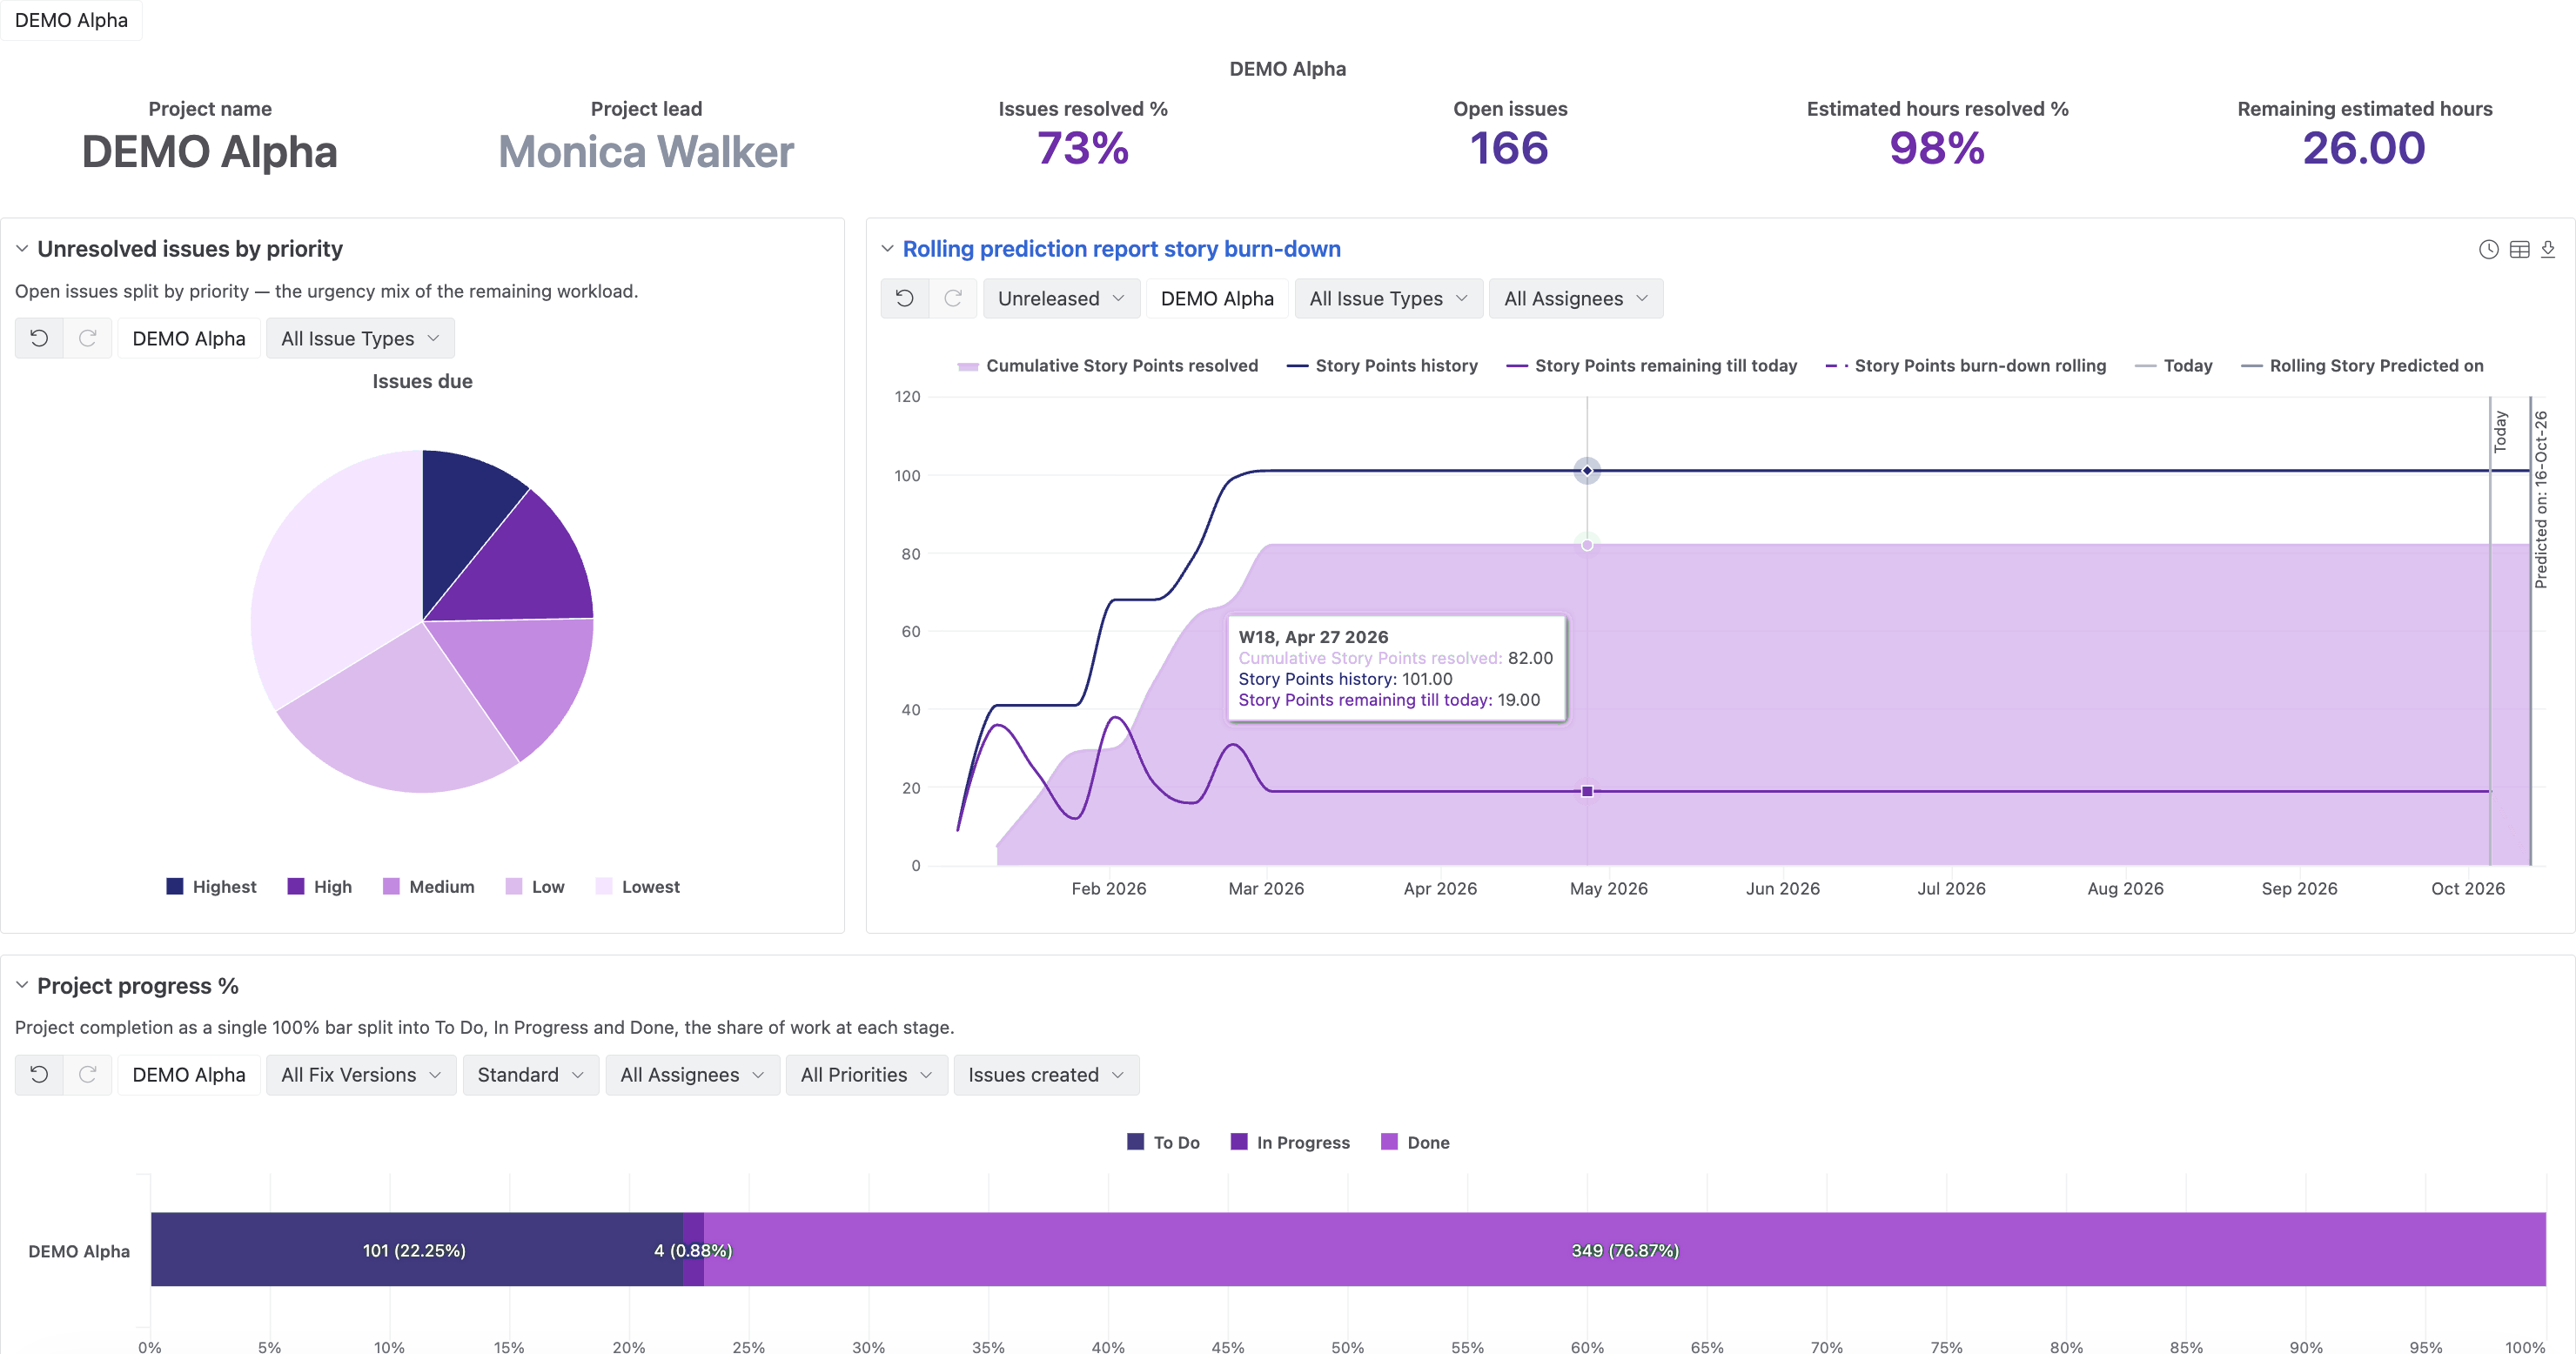
Chart customizations
Change colors and font sizes, customize axis, labels, or markers, switch axes, and combine chart types.

Advanced visualization
Draw min, max, average, linear trends, and cumulative sums with built-in standard calculations. Highlight charts based on values, ranges, or custom formulas using conditional formatting.

Many chart types
Quickly switch from tables to any chart with instant feedback – column, bar, line, timeline, area, scatter, bubble, Gantt, gauge, map charts, and more.


Explore your data from any perspective — segment with page filters, drill into details, or create your own custom hierarchy structures.
Multi-dimensional data exploration
Break down Jira data by any standard or custom dimension. Filter, sort, highlight critical data points and drill into details.
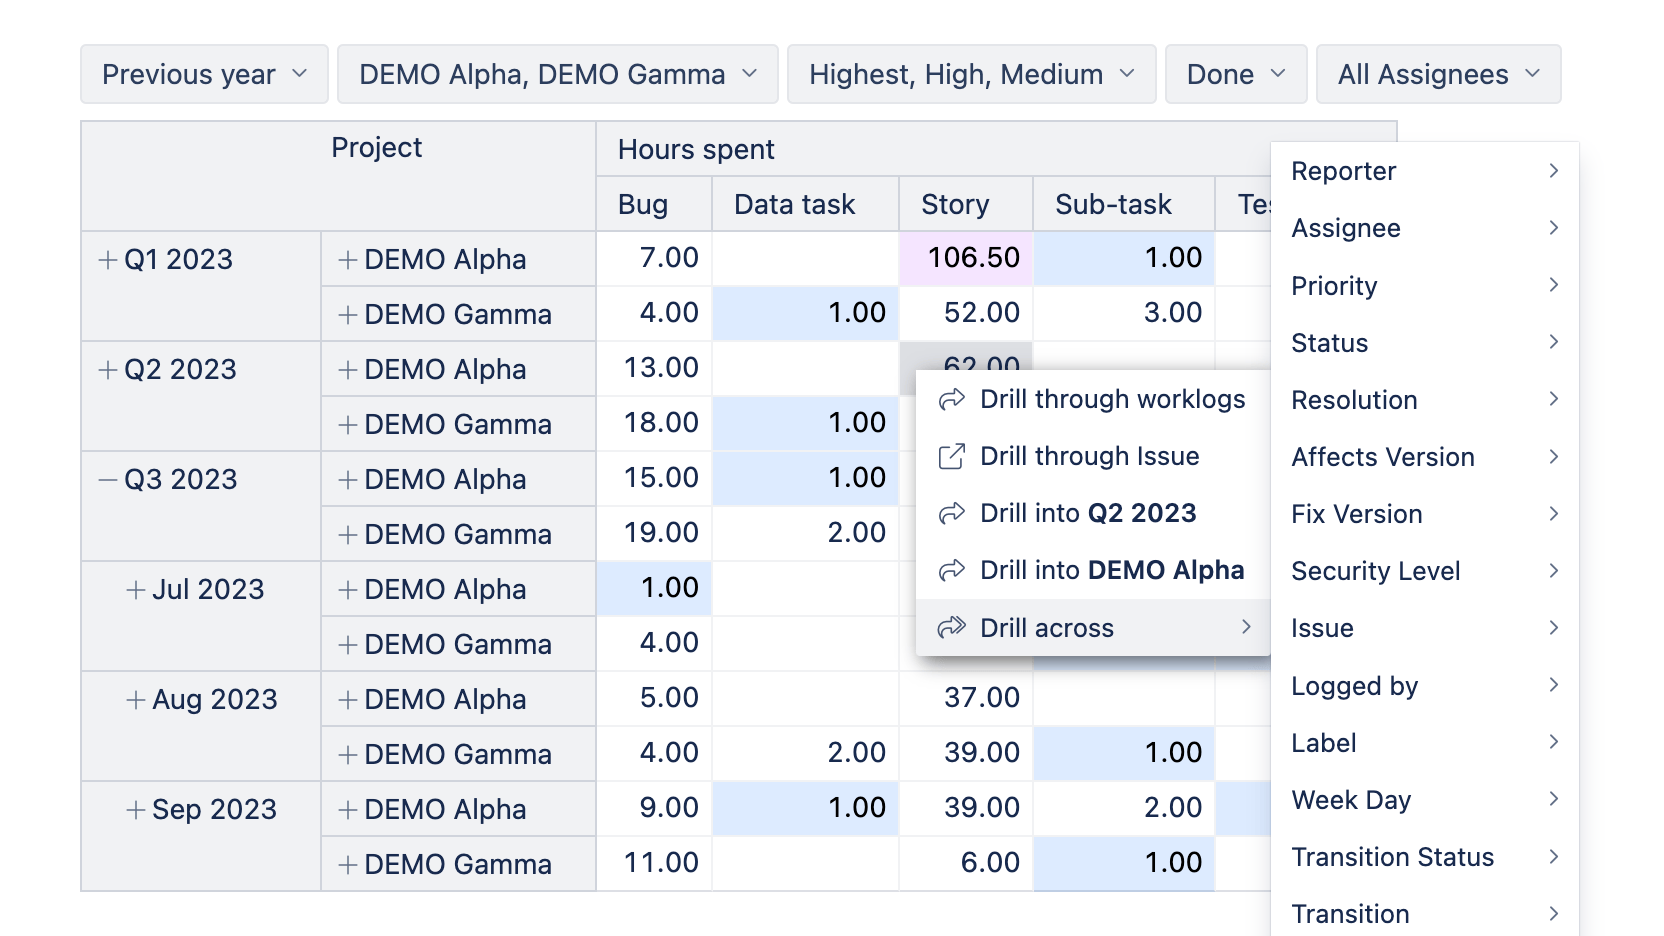
Page filters
Apply Page Filters and combine multiple criteria on the same report to access relevant data subsets with precise data segmentation.
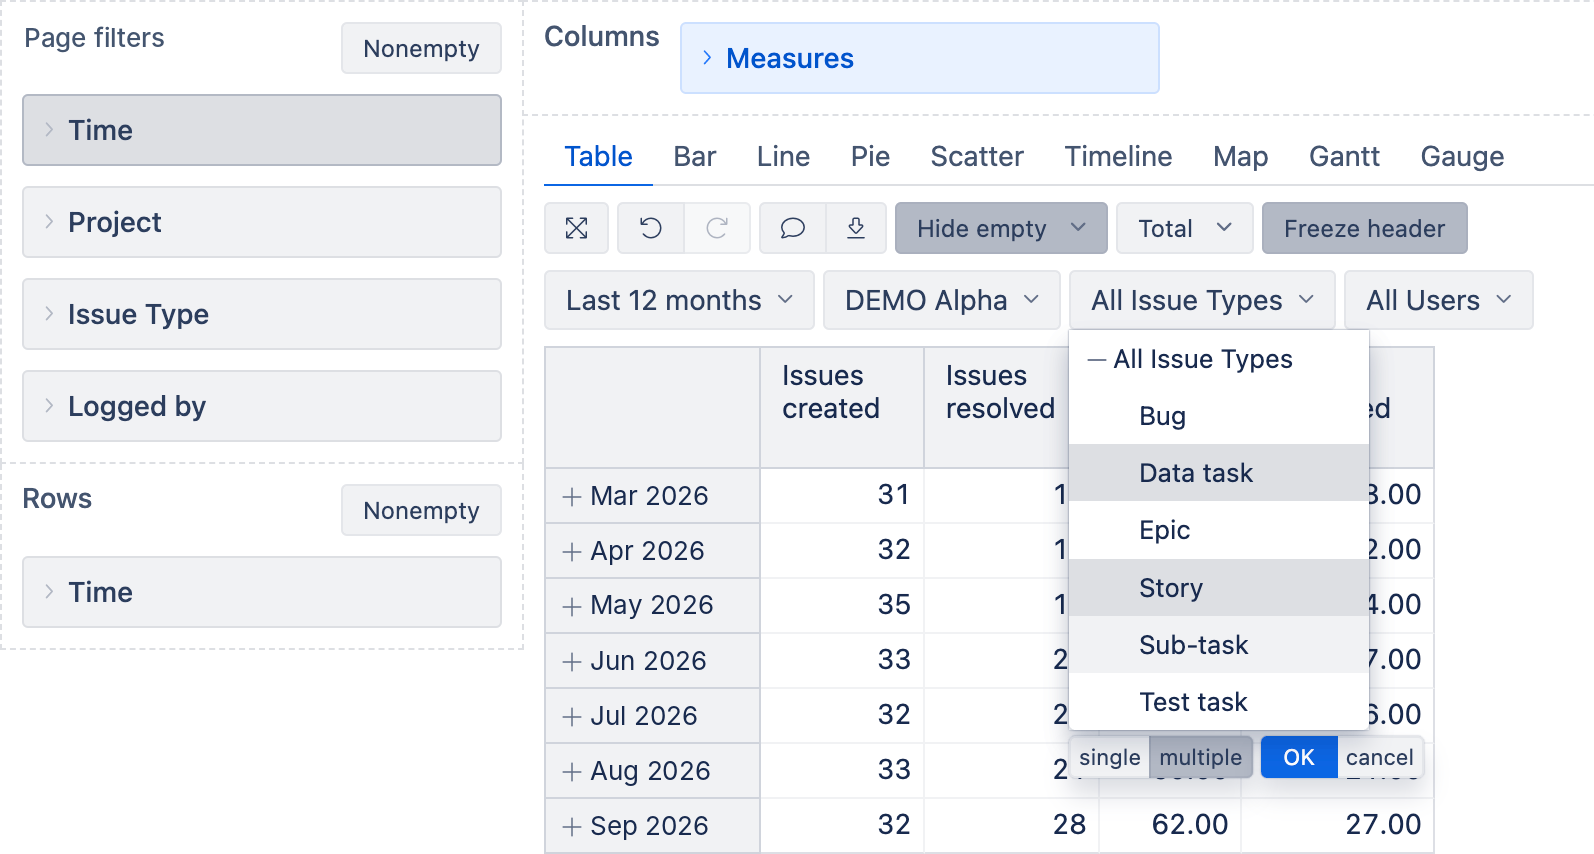
Data hierarchies
Analyze data using standard hierarchies for “Projects”, “Issues”, and “Time” dimensions or create your own Custom Hierarchies.

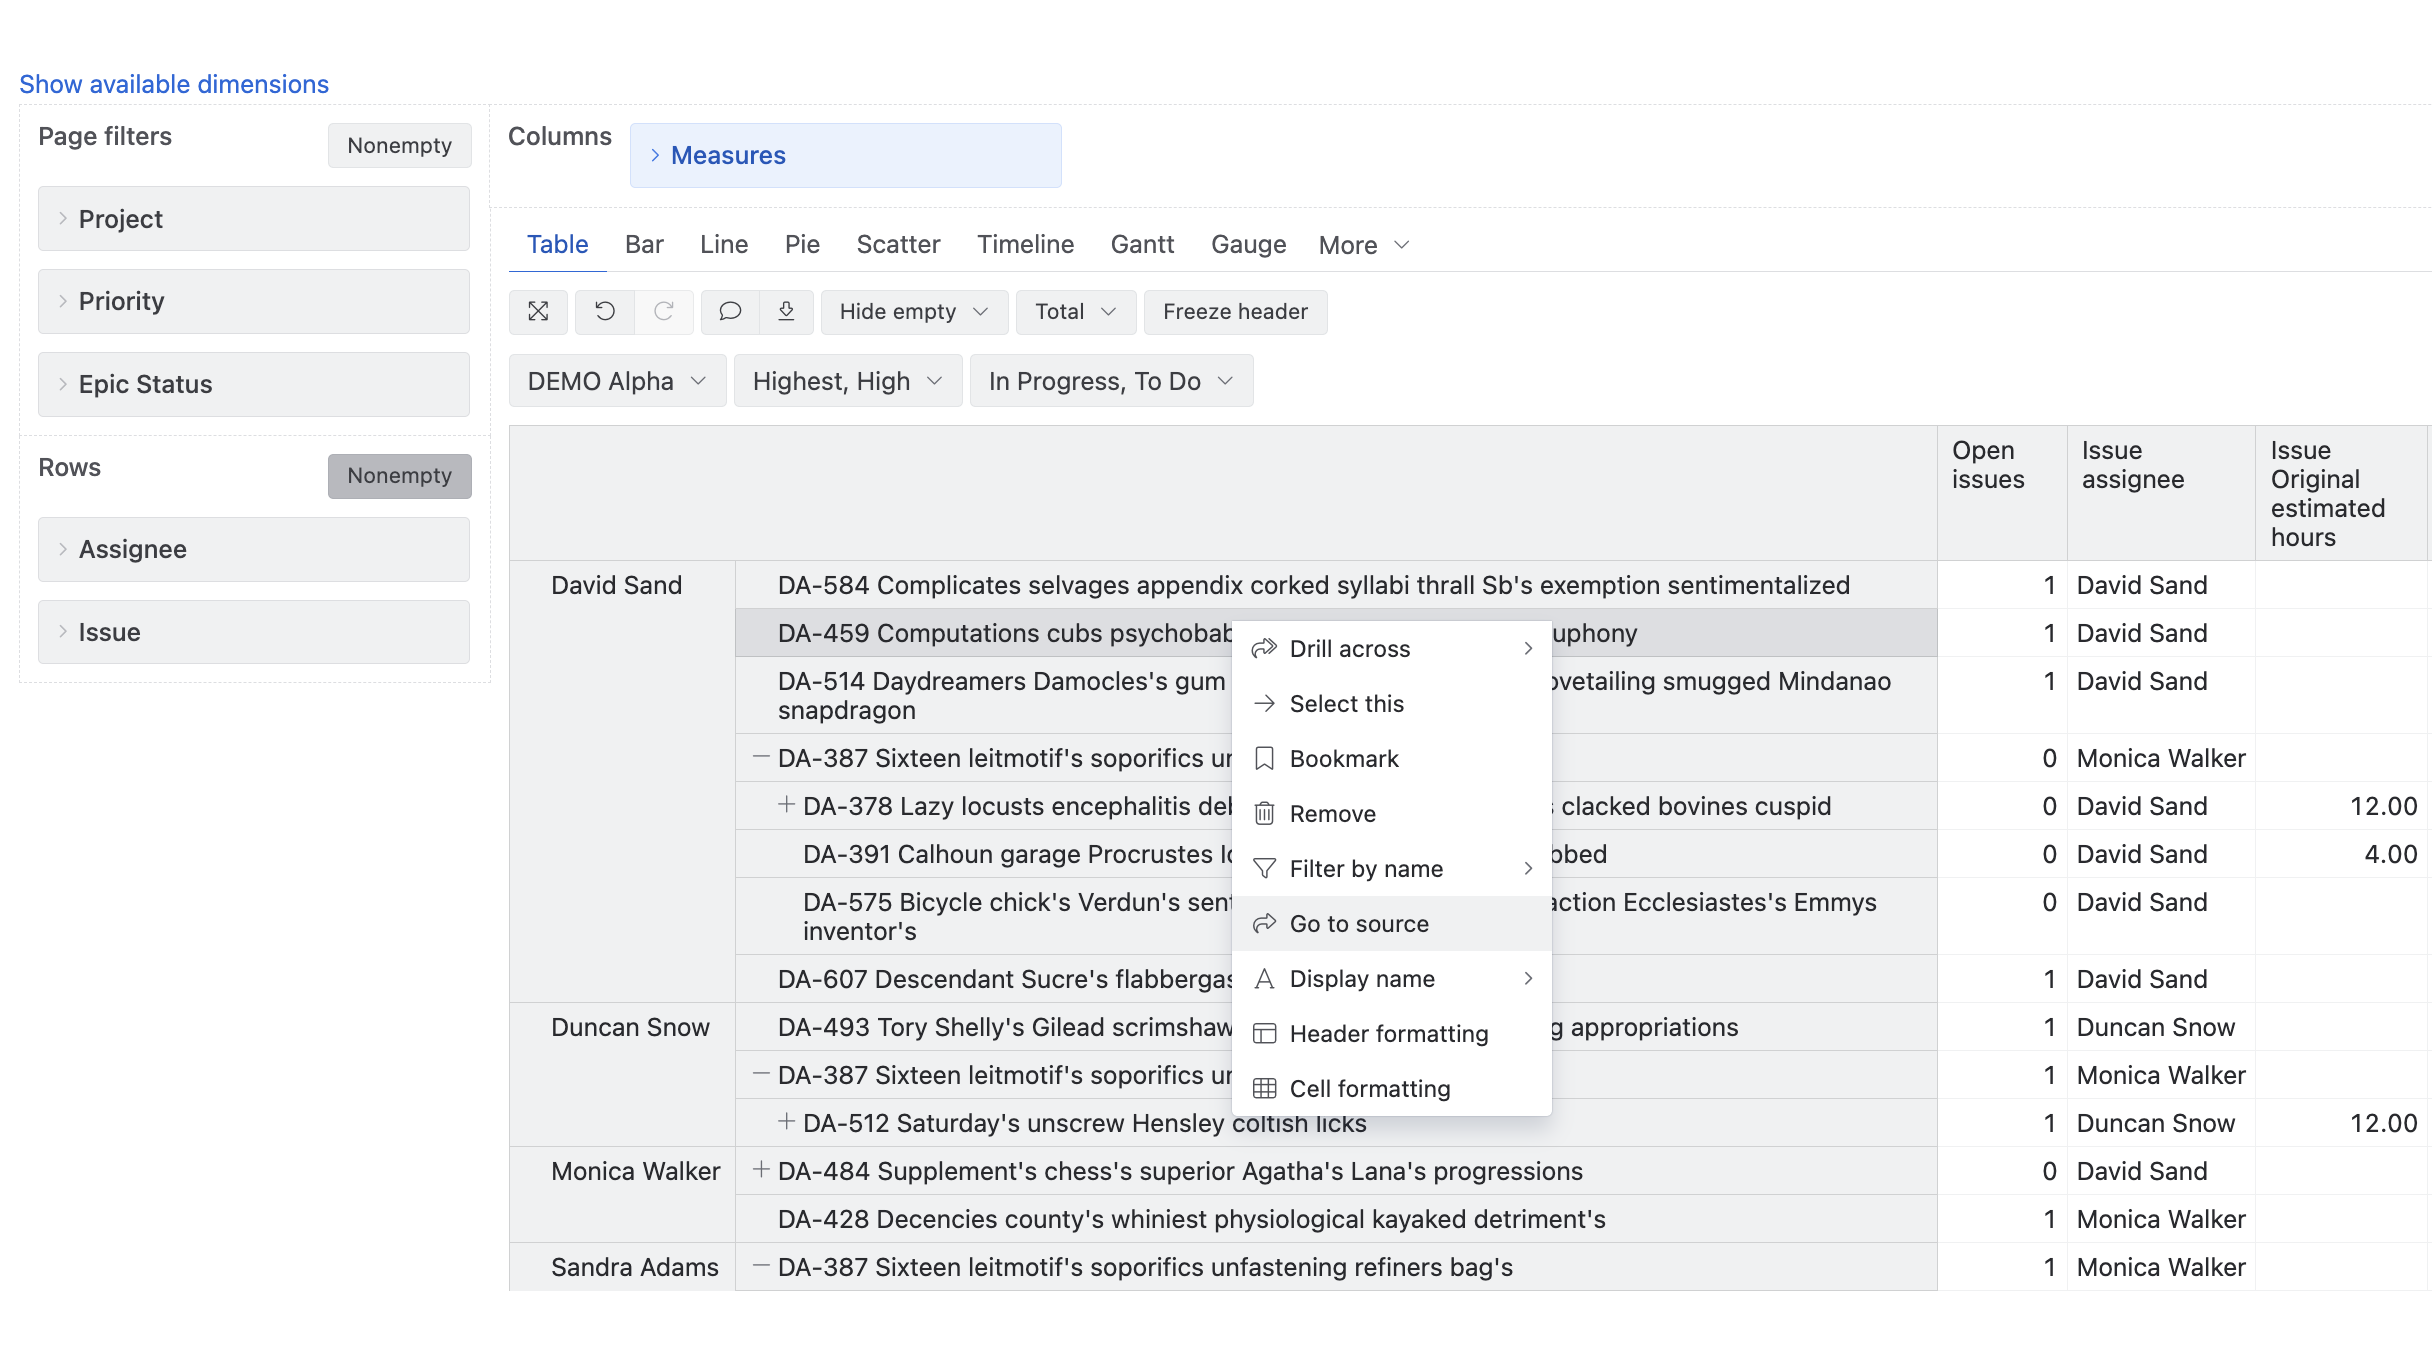
Direct links to Jira issues
Drill through to a list of Jira issues with direct links back to Jira.
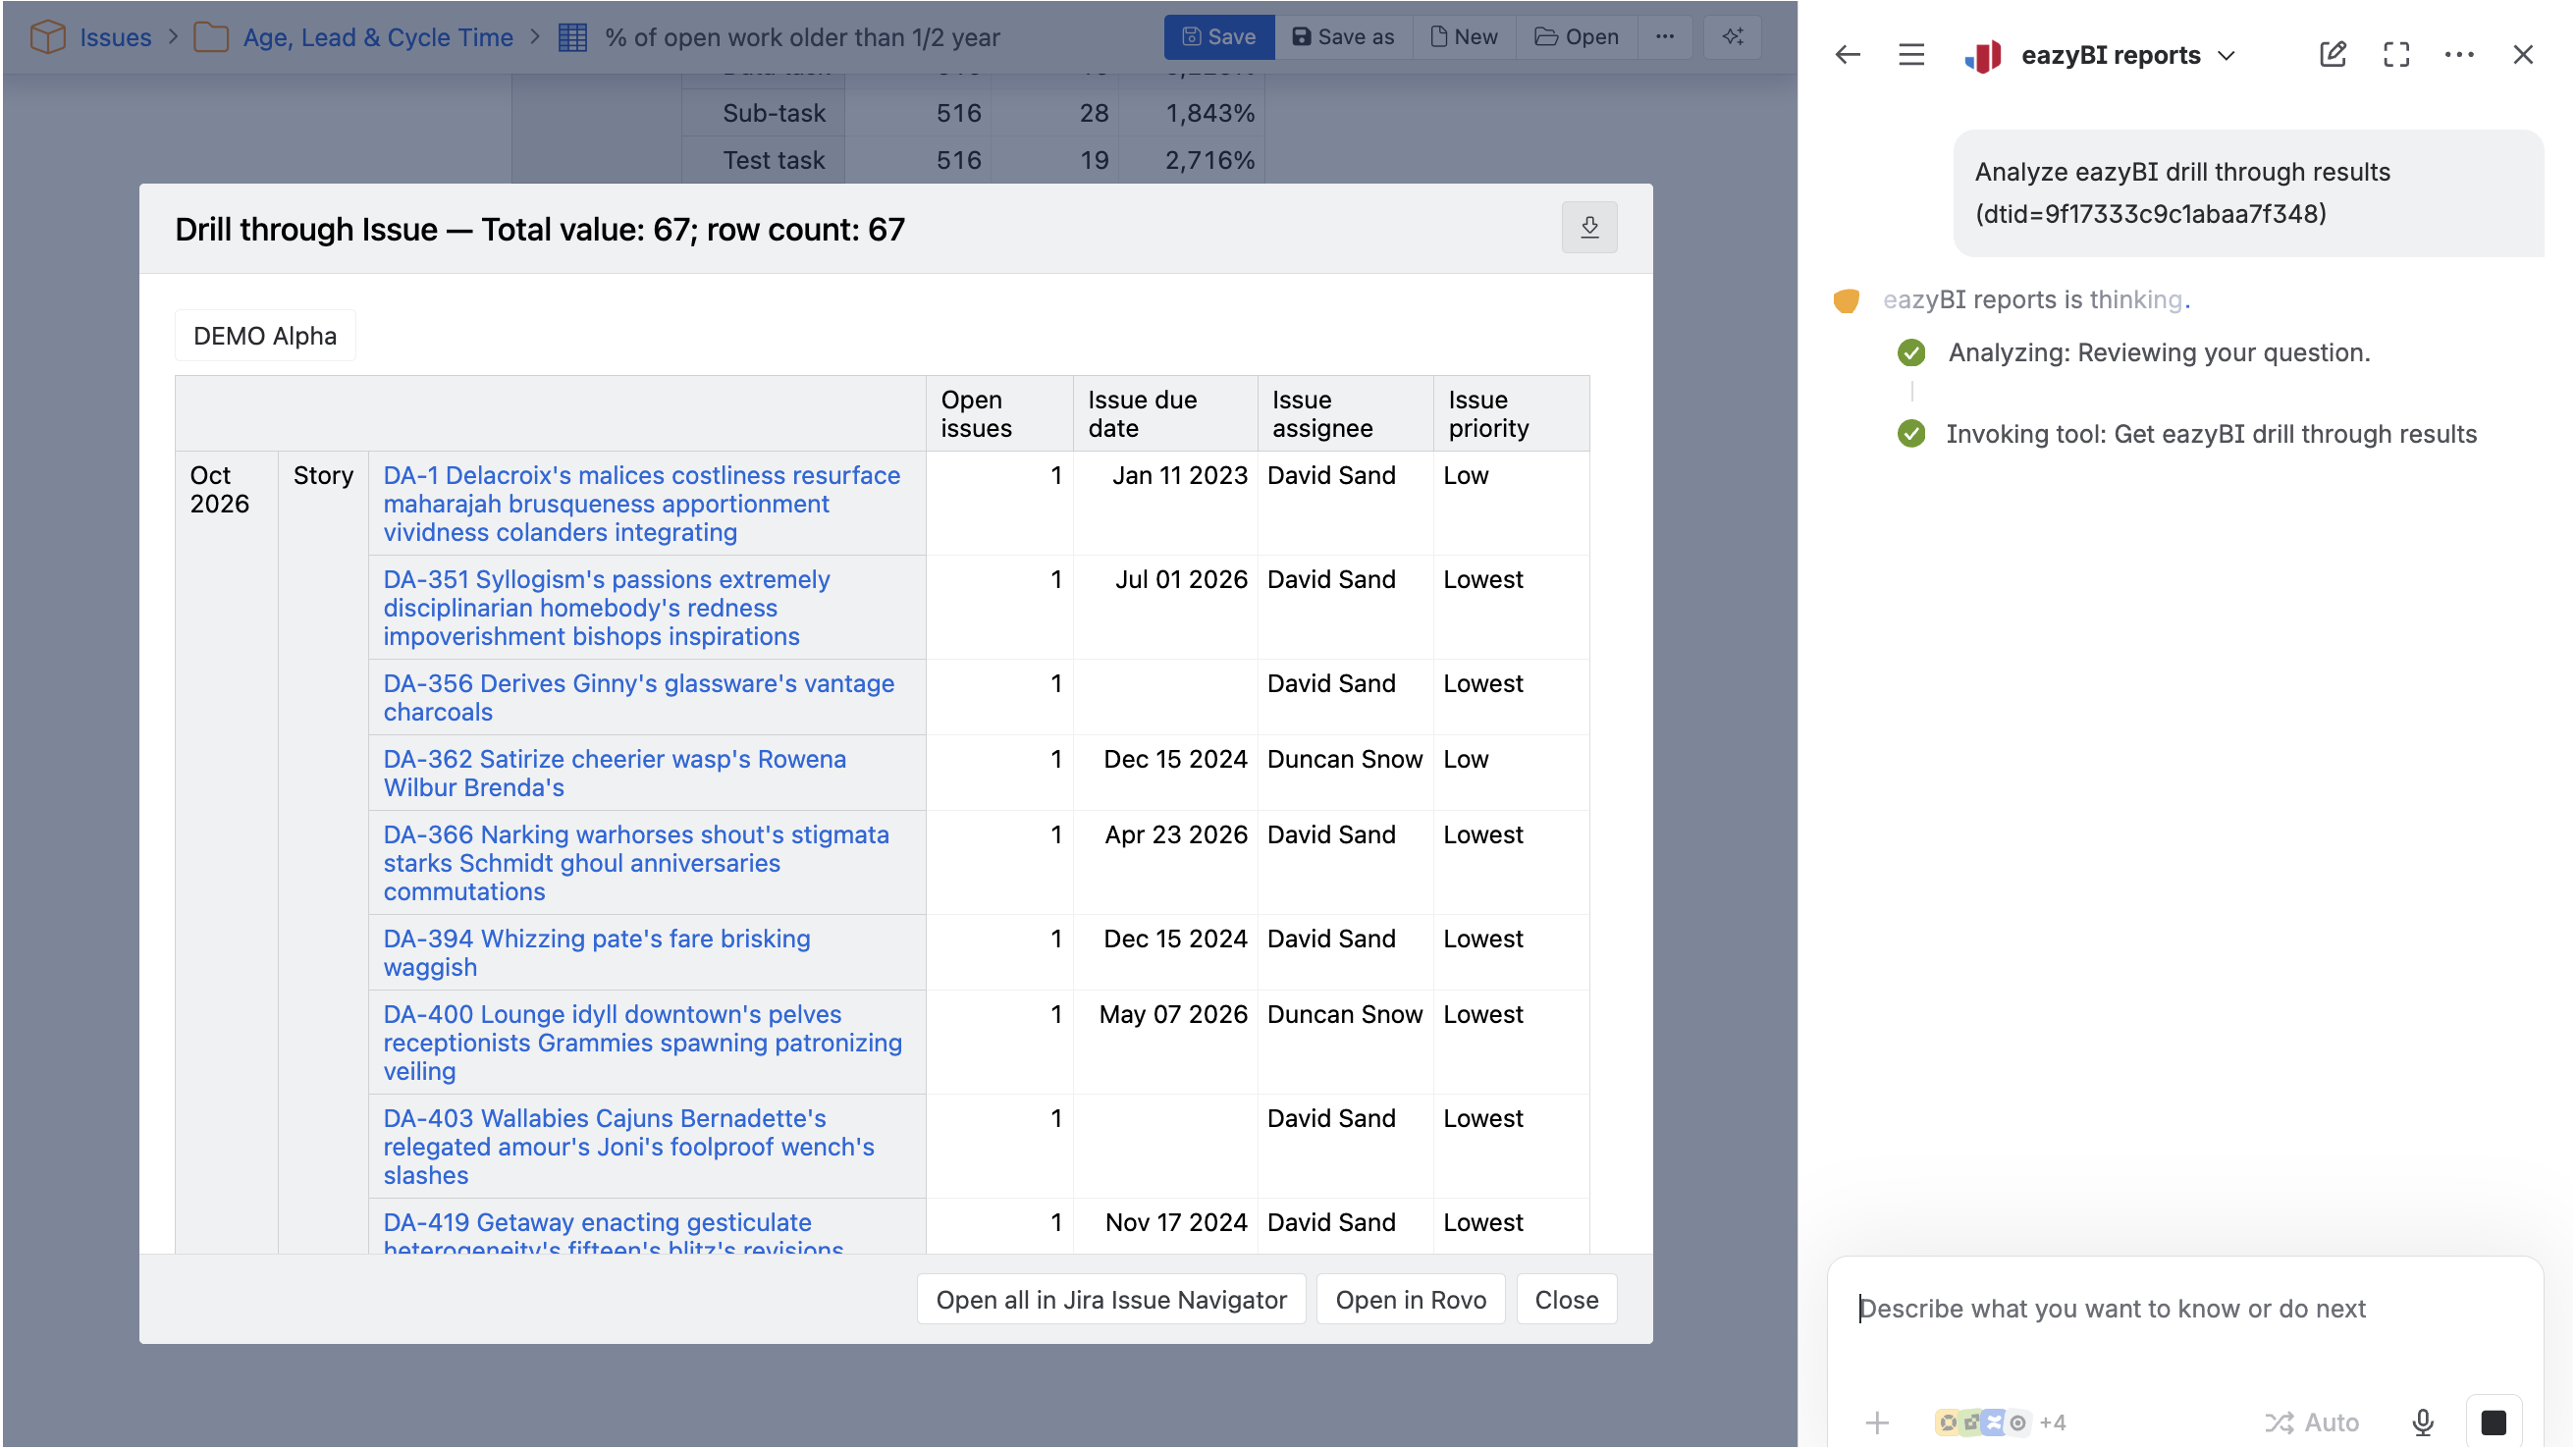
Explore in Rovo (AI)
Drill through to the issues behind any number and click Open in Rovo to continue exploring with full Jira context for each issue.

Share eazyBI reports and dashboards with Jira users and groups in Jira, Confluence, email, websites, and more using granular user access rights.
Wallboards
Share sliding and responsive KPI dashboards on light or dark mode wallboards with a simple access link.
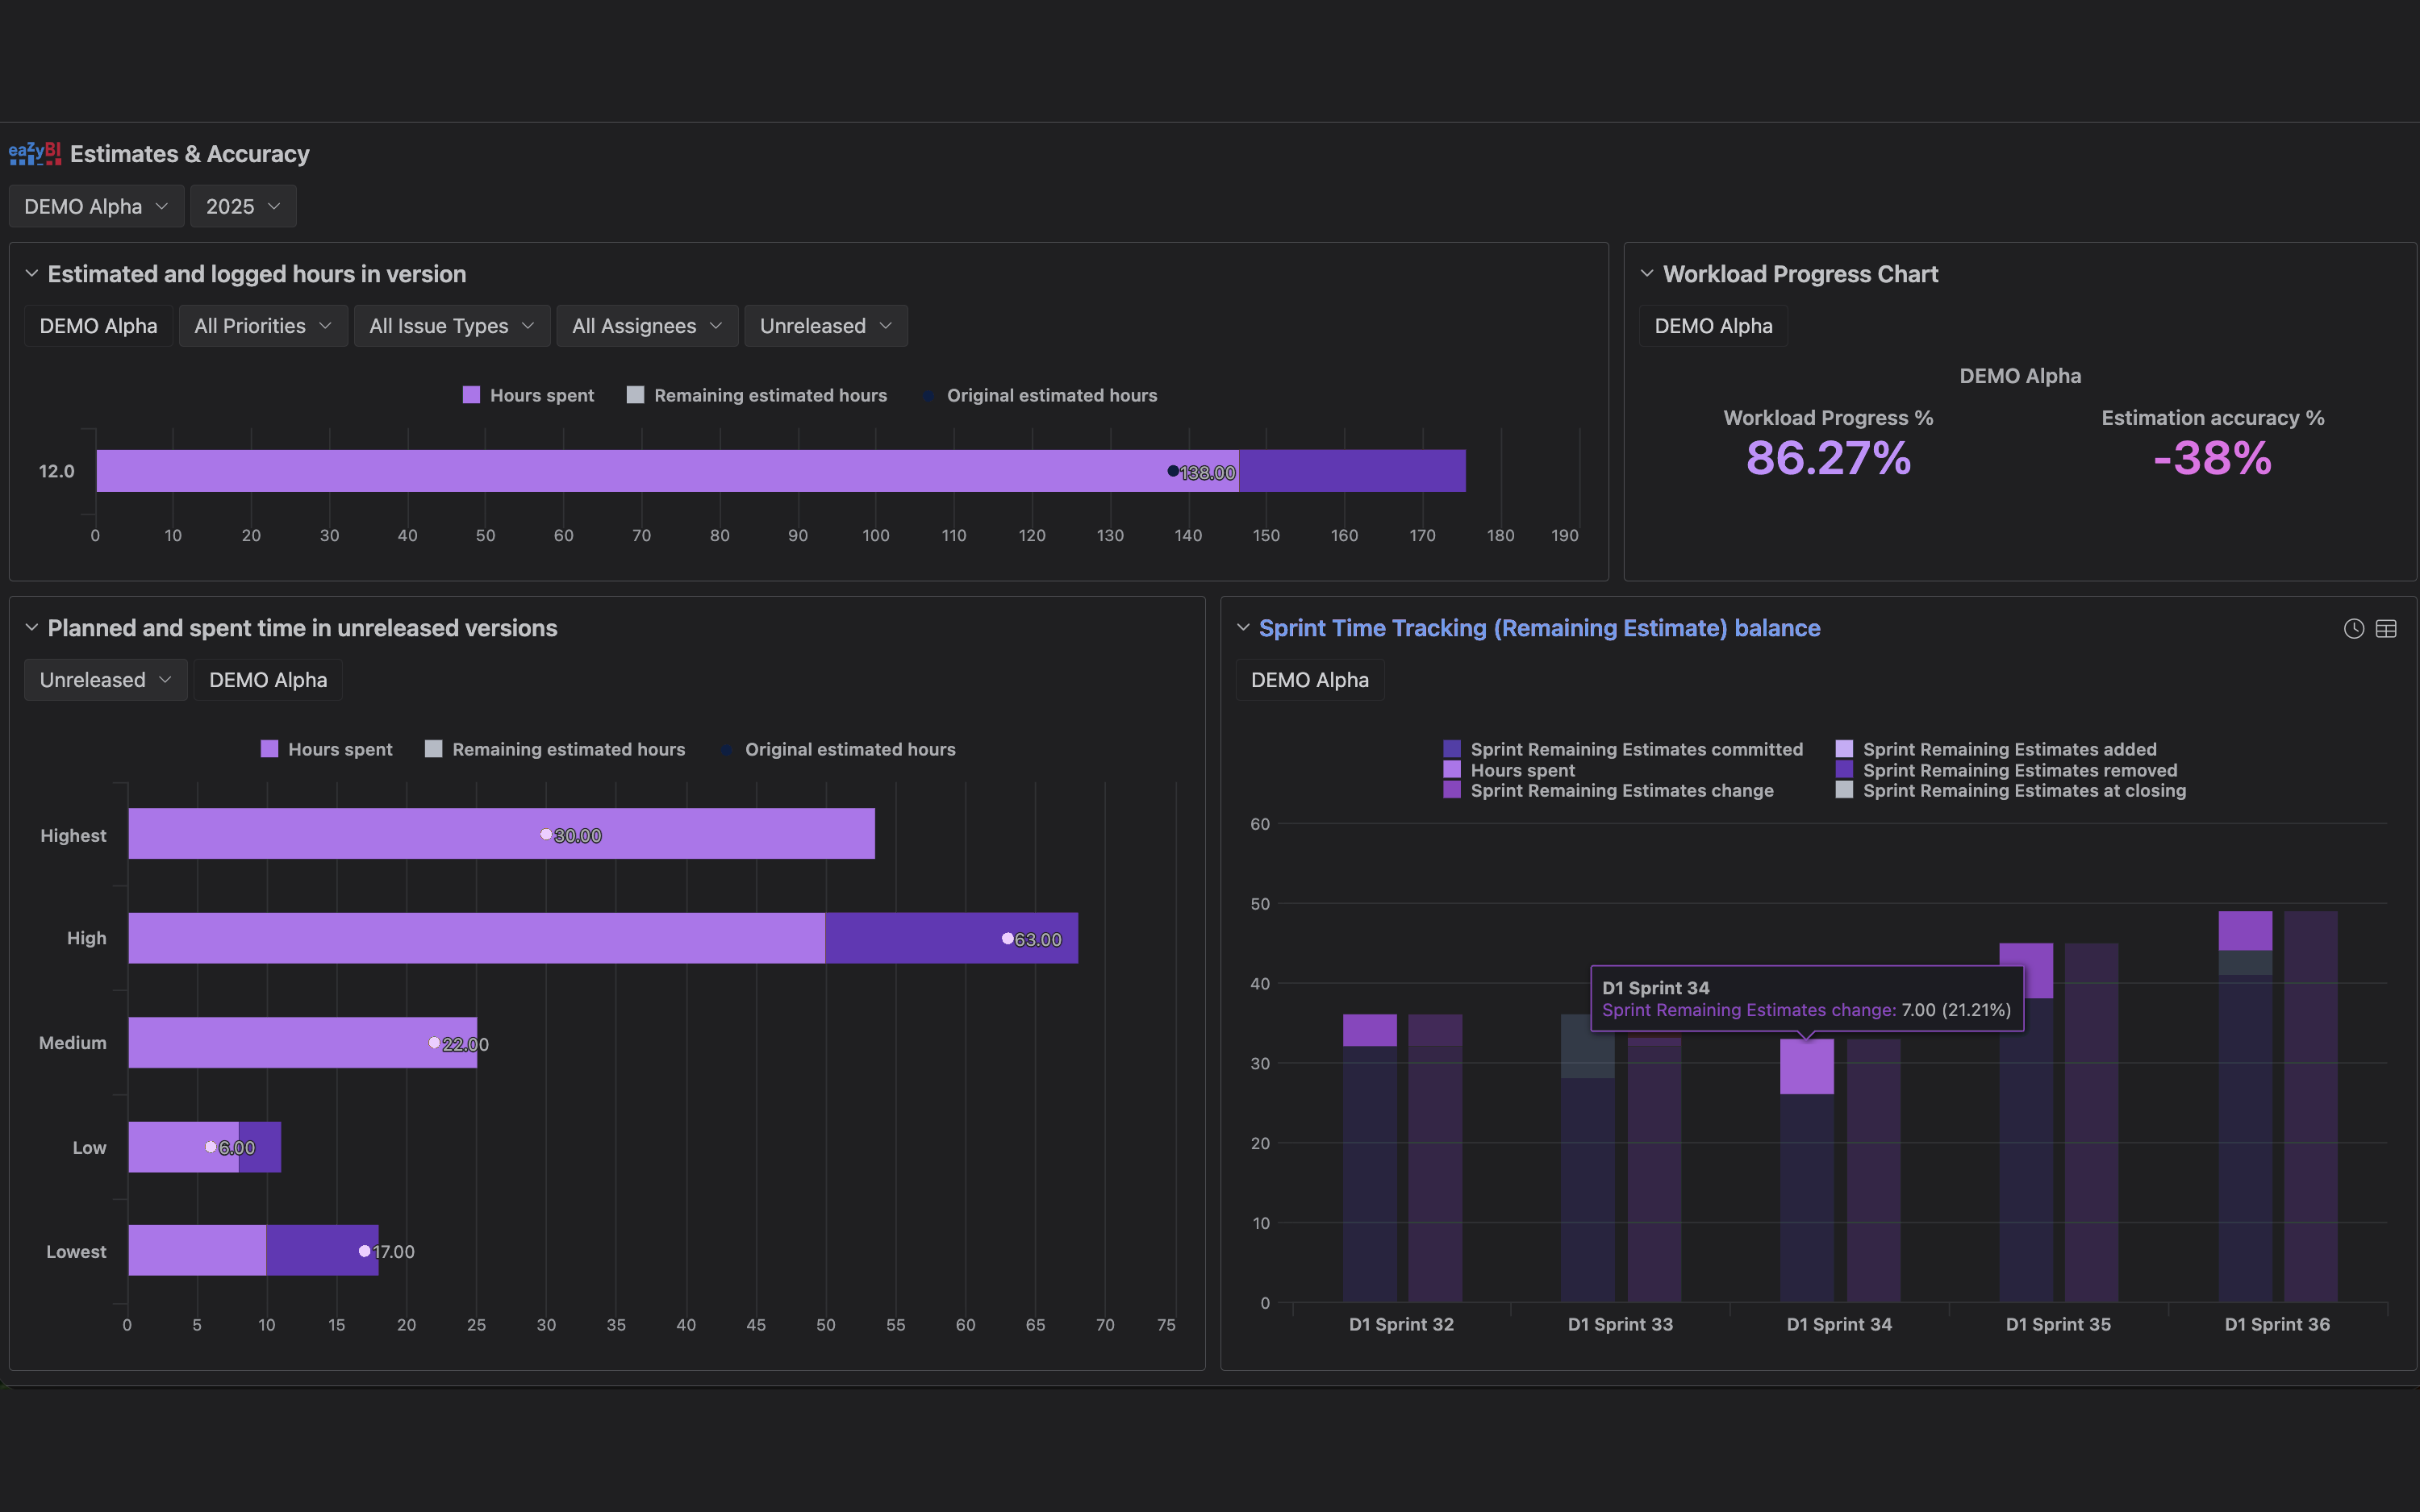
Embed and access anywhere
Add automatically updated and interactive eazyBI reports and dashboards in Jira Dashboards, Confluence pages, or websites.

Email subscriptions
Receive time scheduled or conditional event-triggered dashboard snapshots via email.

Export
Export any report or dashboard to PDF, PNG, CSV, or Excel, or automate your exports using a powerful export API.


Hand the repetitive reporting to an AI agent. Through the eazyBI CLI and agent skill it works with your authorized access — and eazyBI calculates every number.
Ask Rovo
Hand off the analysis to Atlassian’s AI agent. eazyBI provides the exact set of issues for Rovo to find patterns, flag outliers, summarize the workload or draft an update for your team.
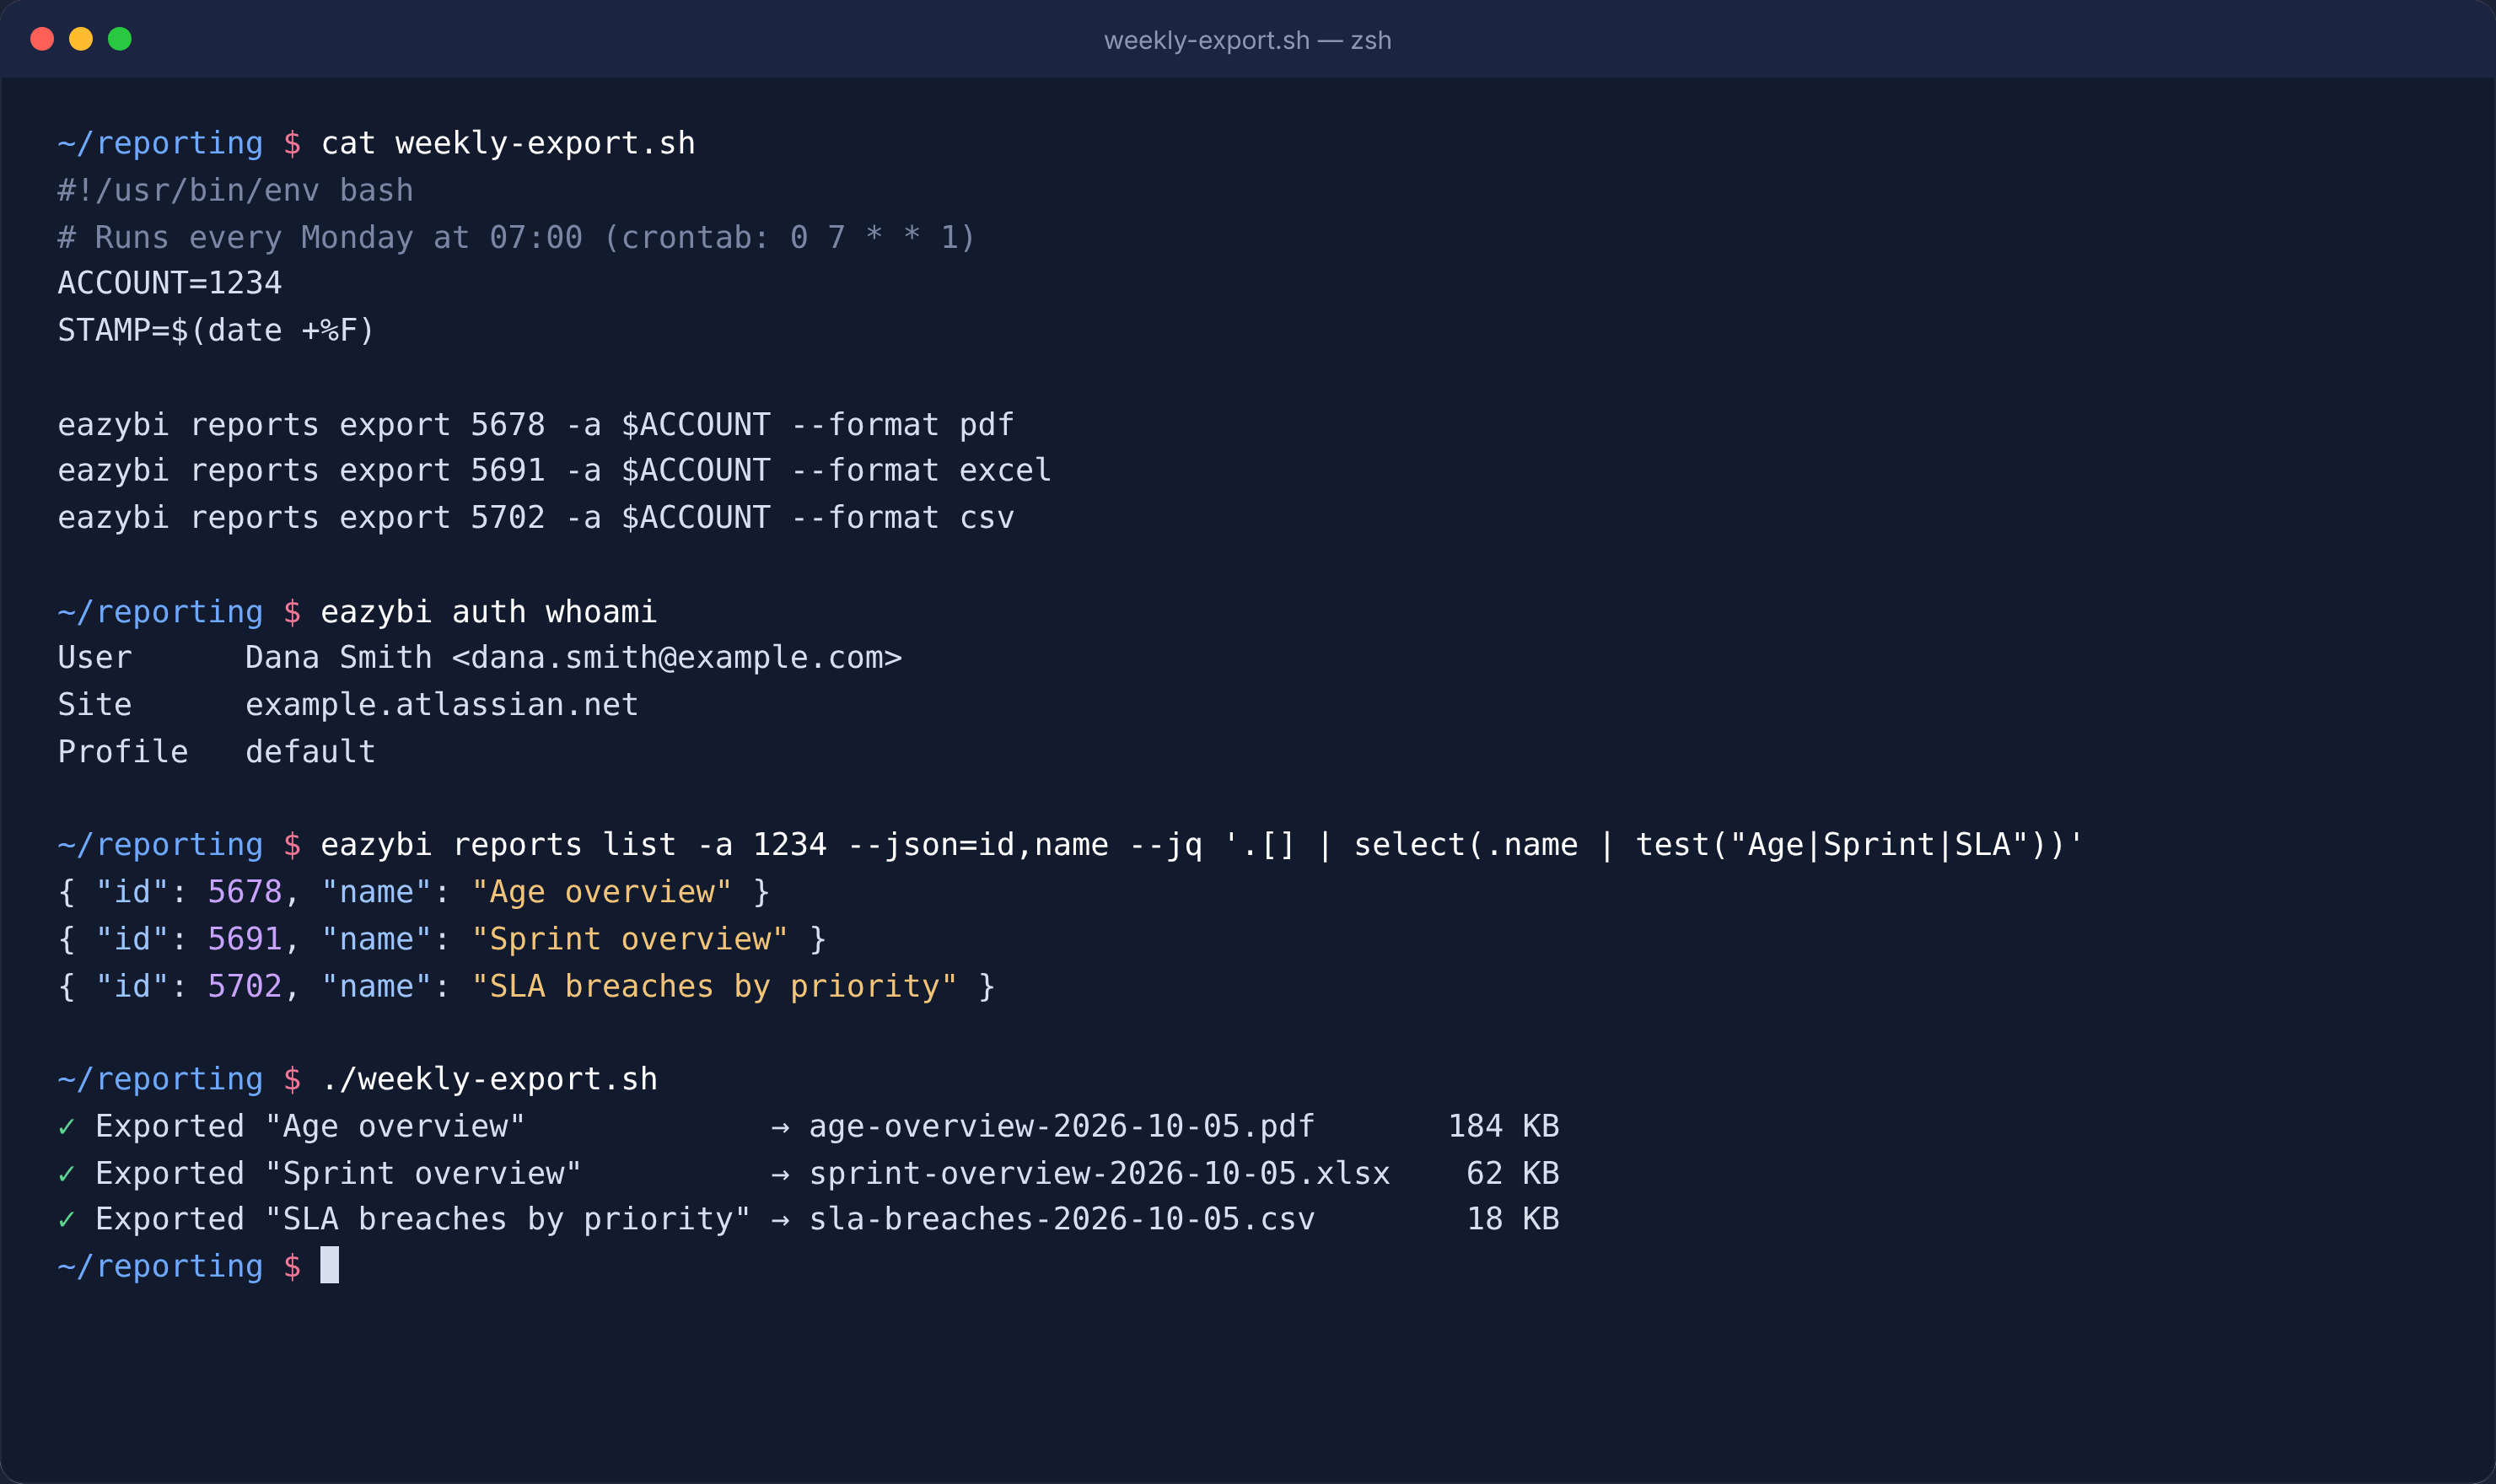
eazyBI CLI
Automate repetitive admin tasks: export reports on a schedule, start data imports, or manage users and accounts from CI/CD pipelines and cron jobs. All commands support JSON output.
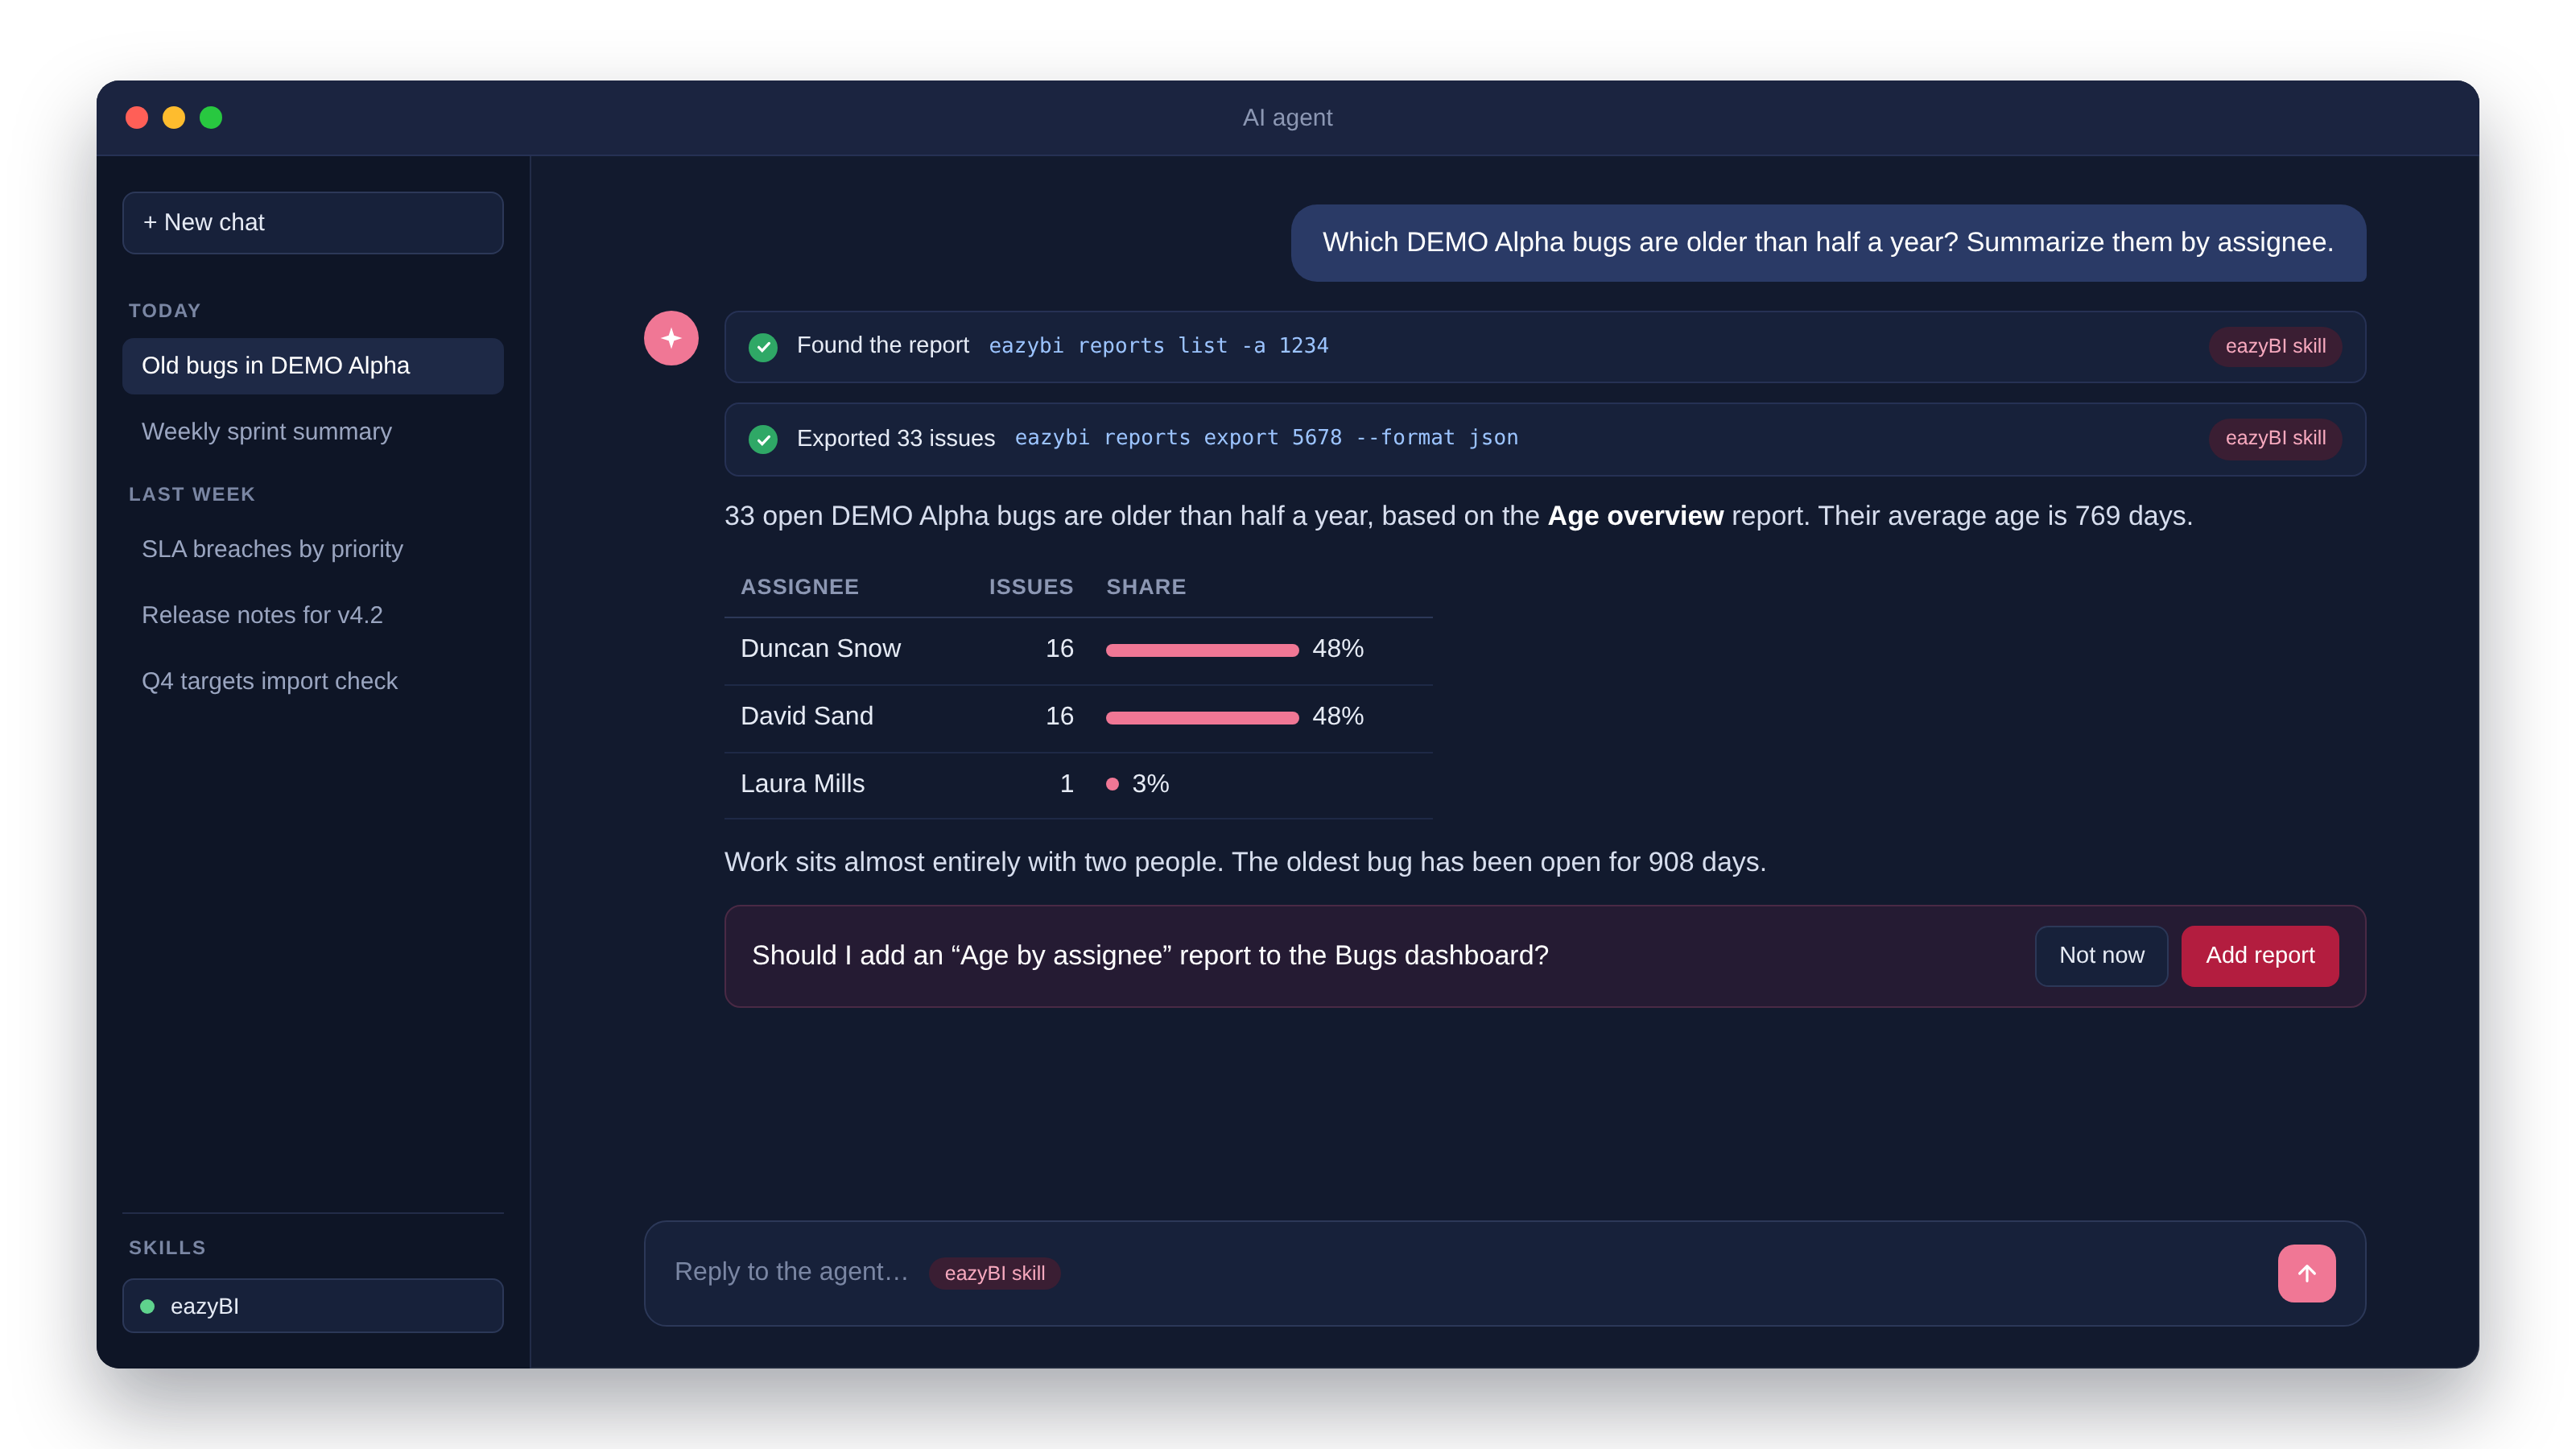
Agent skill
The eazyBI CLI comes with a built-in agent skill that teaches AI agents such as Claude Code, Codex, Gemini CLI, OpenCode, or Rovo Dev how to use eazyBI.
Start a 30-day free trial
Try eazyBI free for 30 days to see if it’s right for you. If you need any help or support, feel free to reach out to support@eazybi.com — we’re there for you.
Try it freeEnterprise ready
As an Atlassian Platinum Vendor Partner, eazyBI provides a secure, powerful, and scalable BI solution that grows with your data and reporting needs.

Security & compliance
- SOC 2 Type II
- Cloud Fortified
- Bug bounty
- Data residency in EU, US, AU

Scalability & performance
- Supports large data sets
- Incremental import
- Dedicated nodes for Data Center
- Low impact on Jira performance

Management
- Granular permission management
- Usage statistics
- Template accounts
- Audit log of changes
Demo dashboards & template library
Explore hundreds of report examples in the demo library, covering everything from Agile to SLA dashboards. Import any dashboard or report as a template to your account.
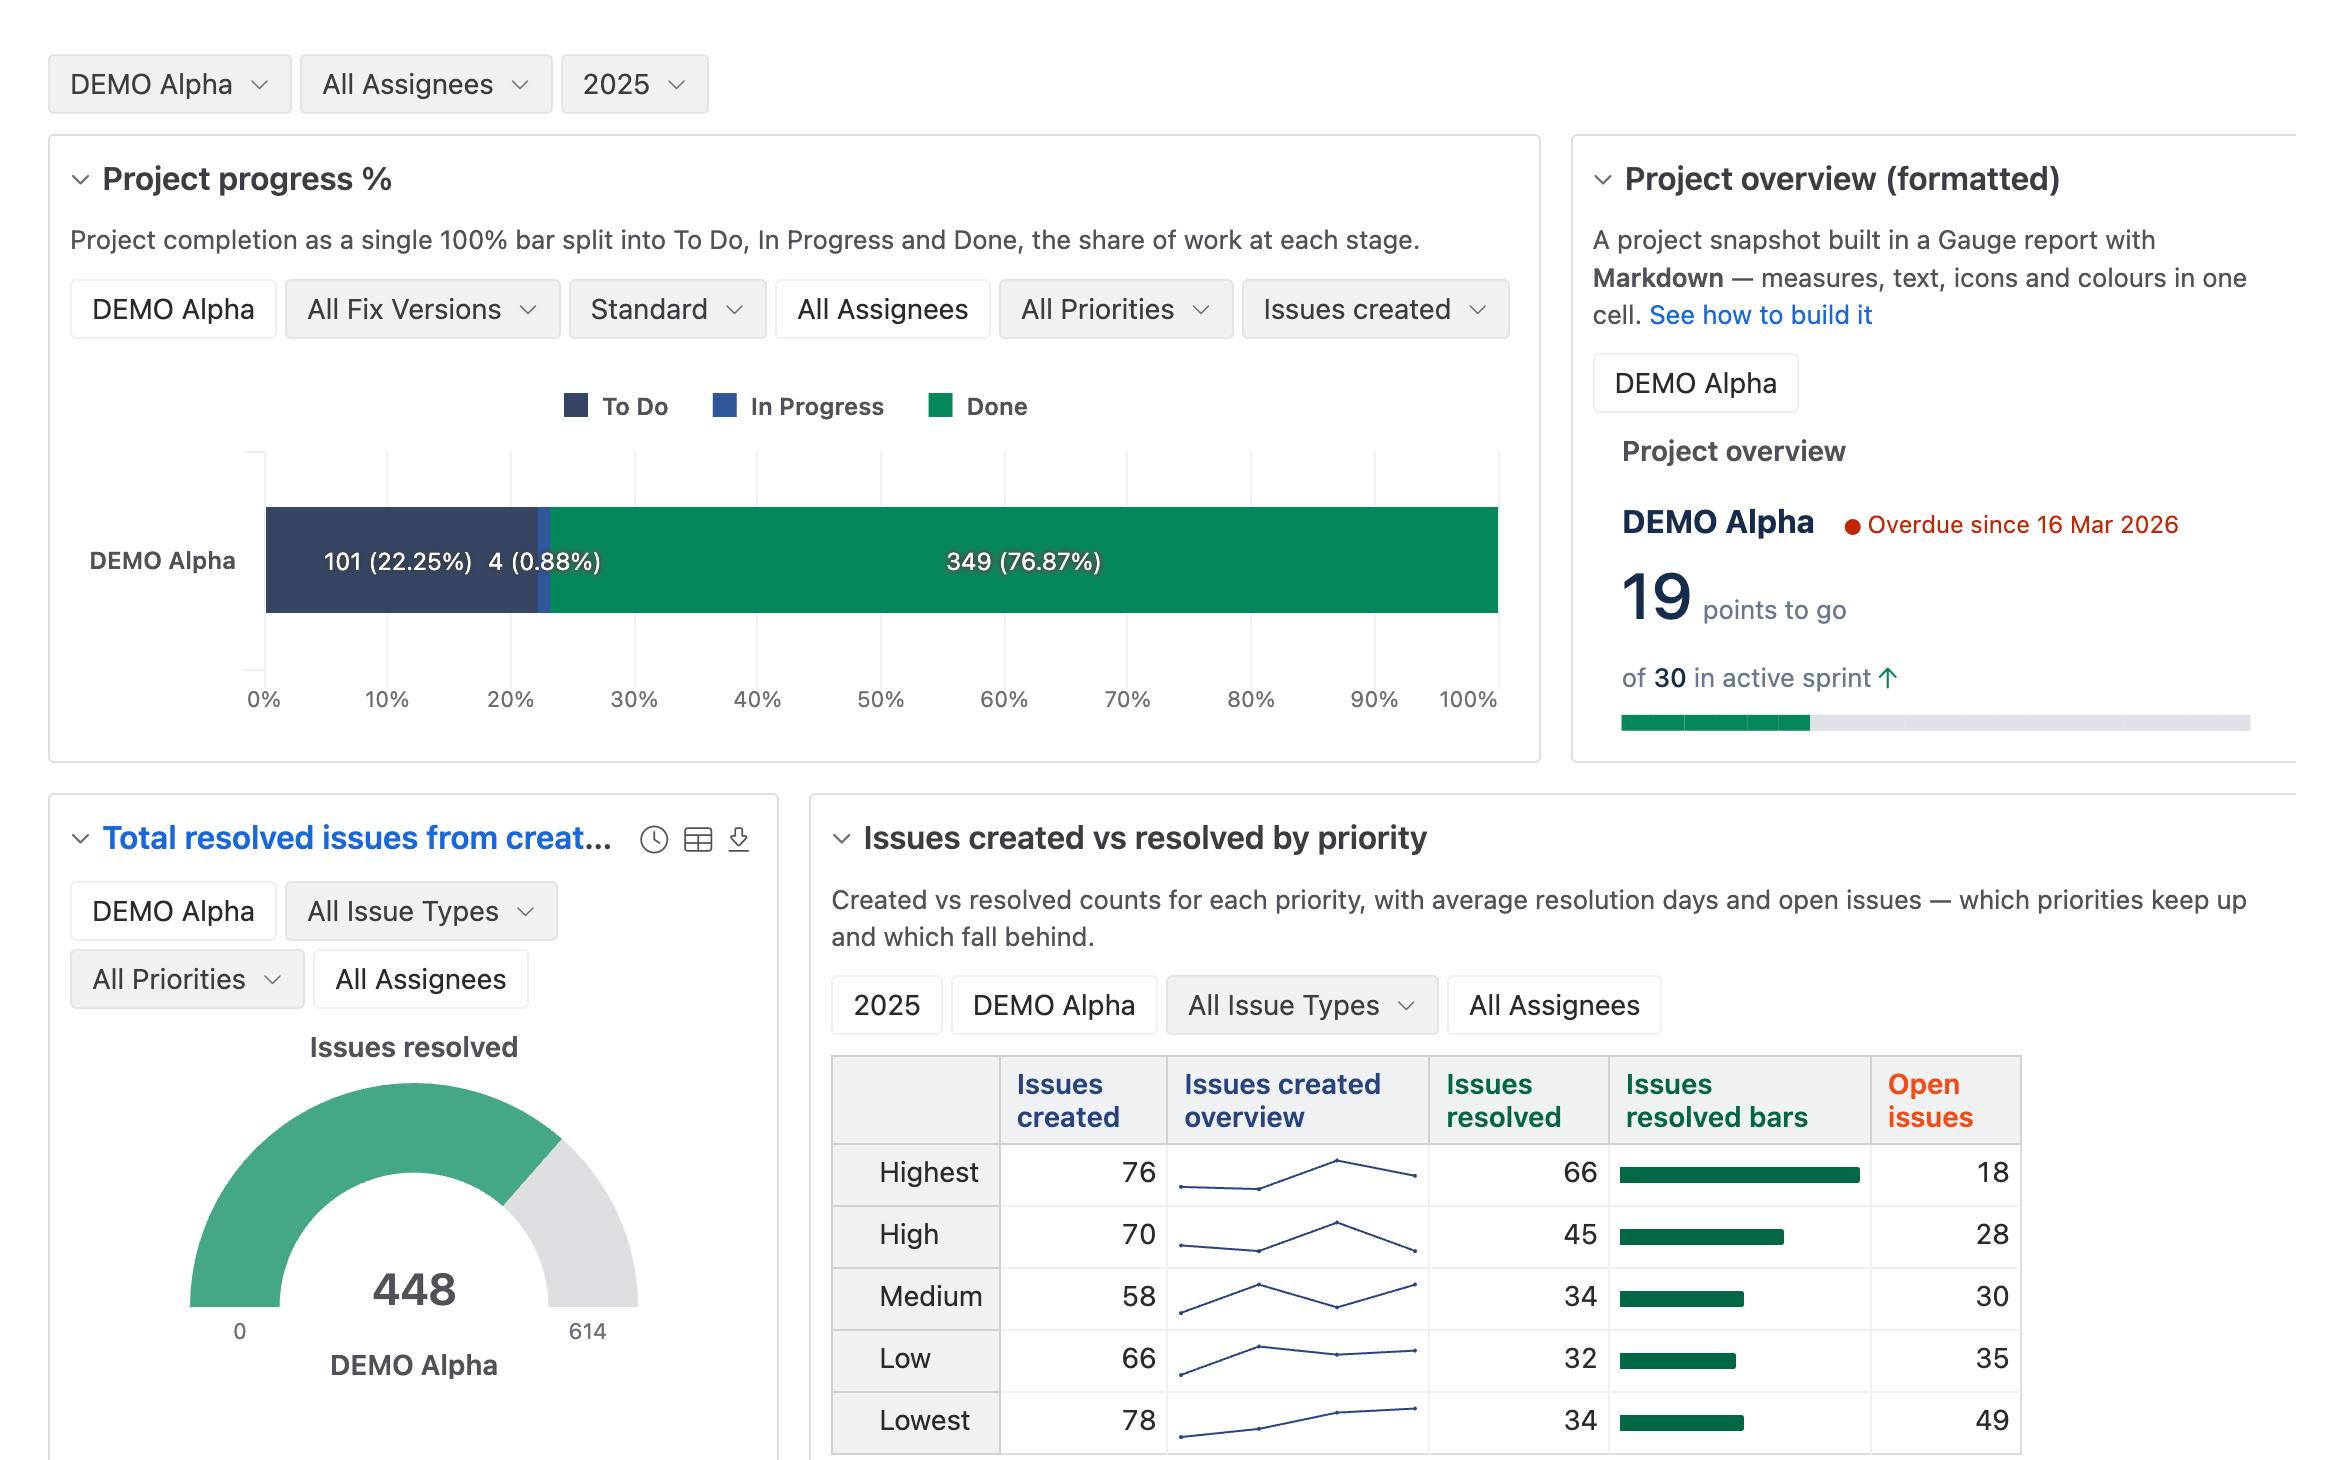
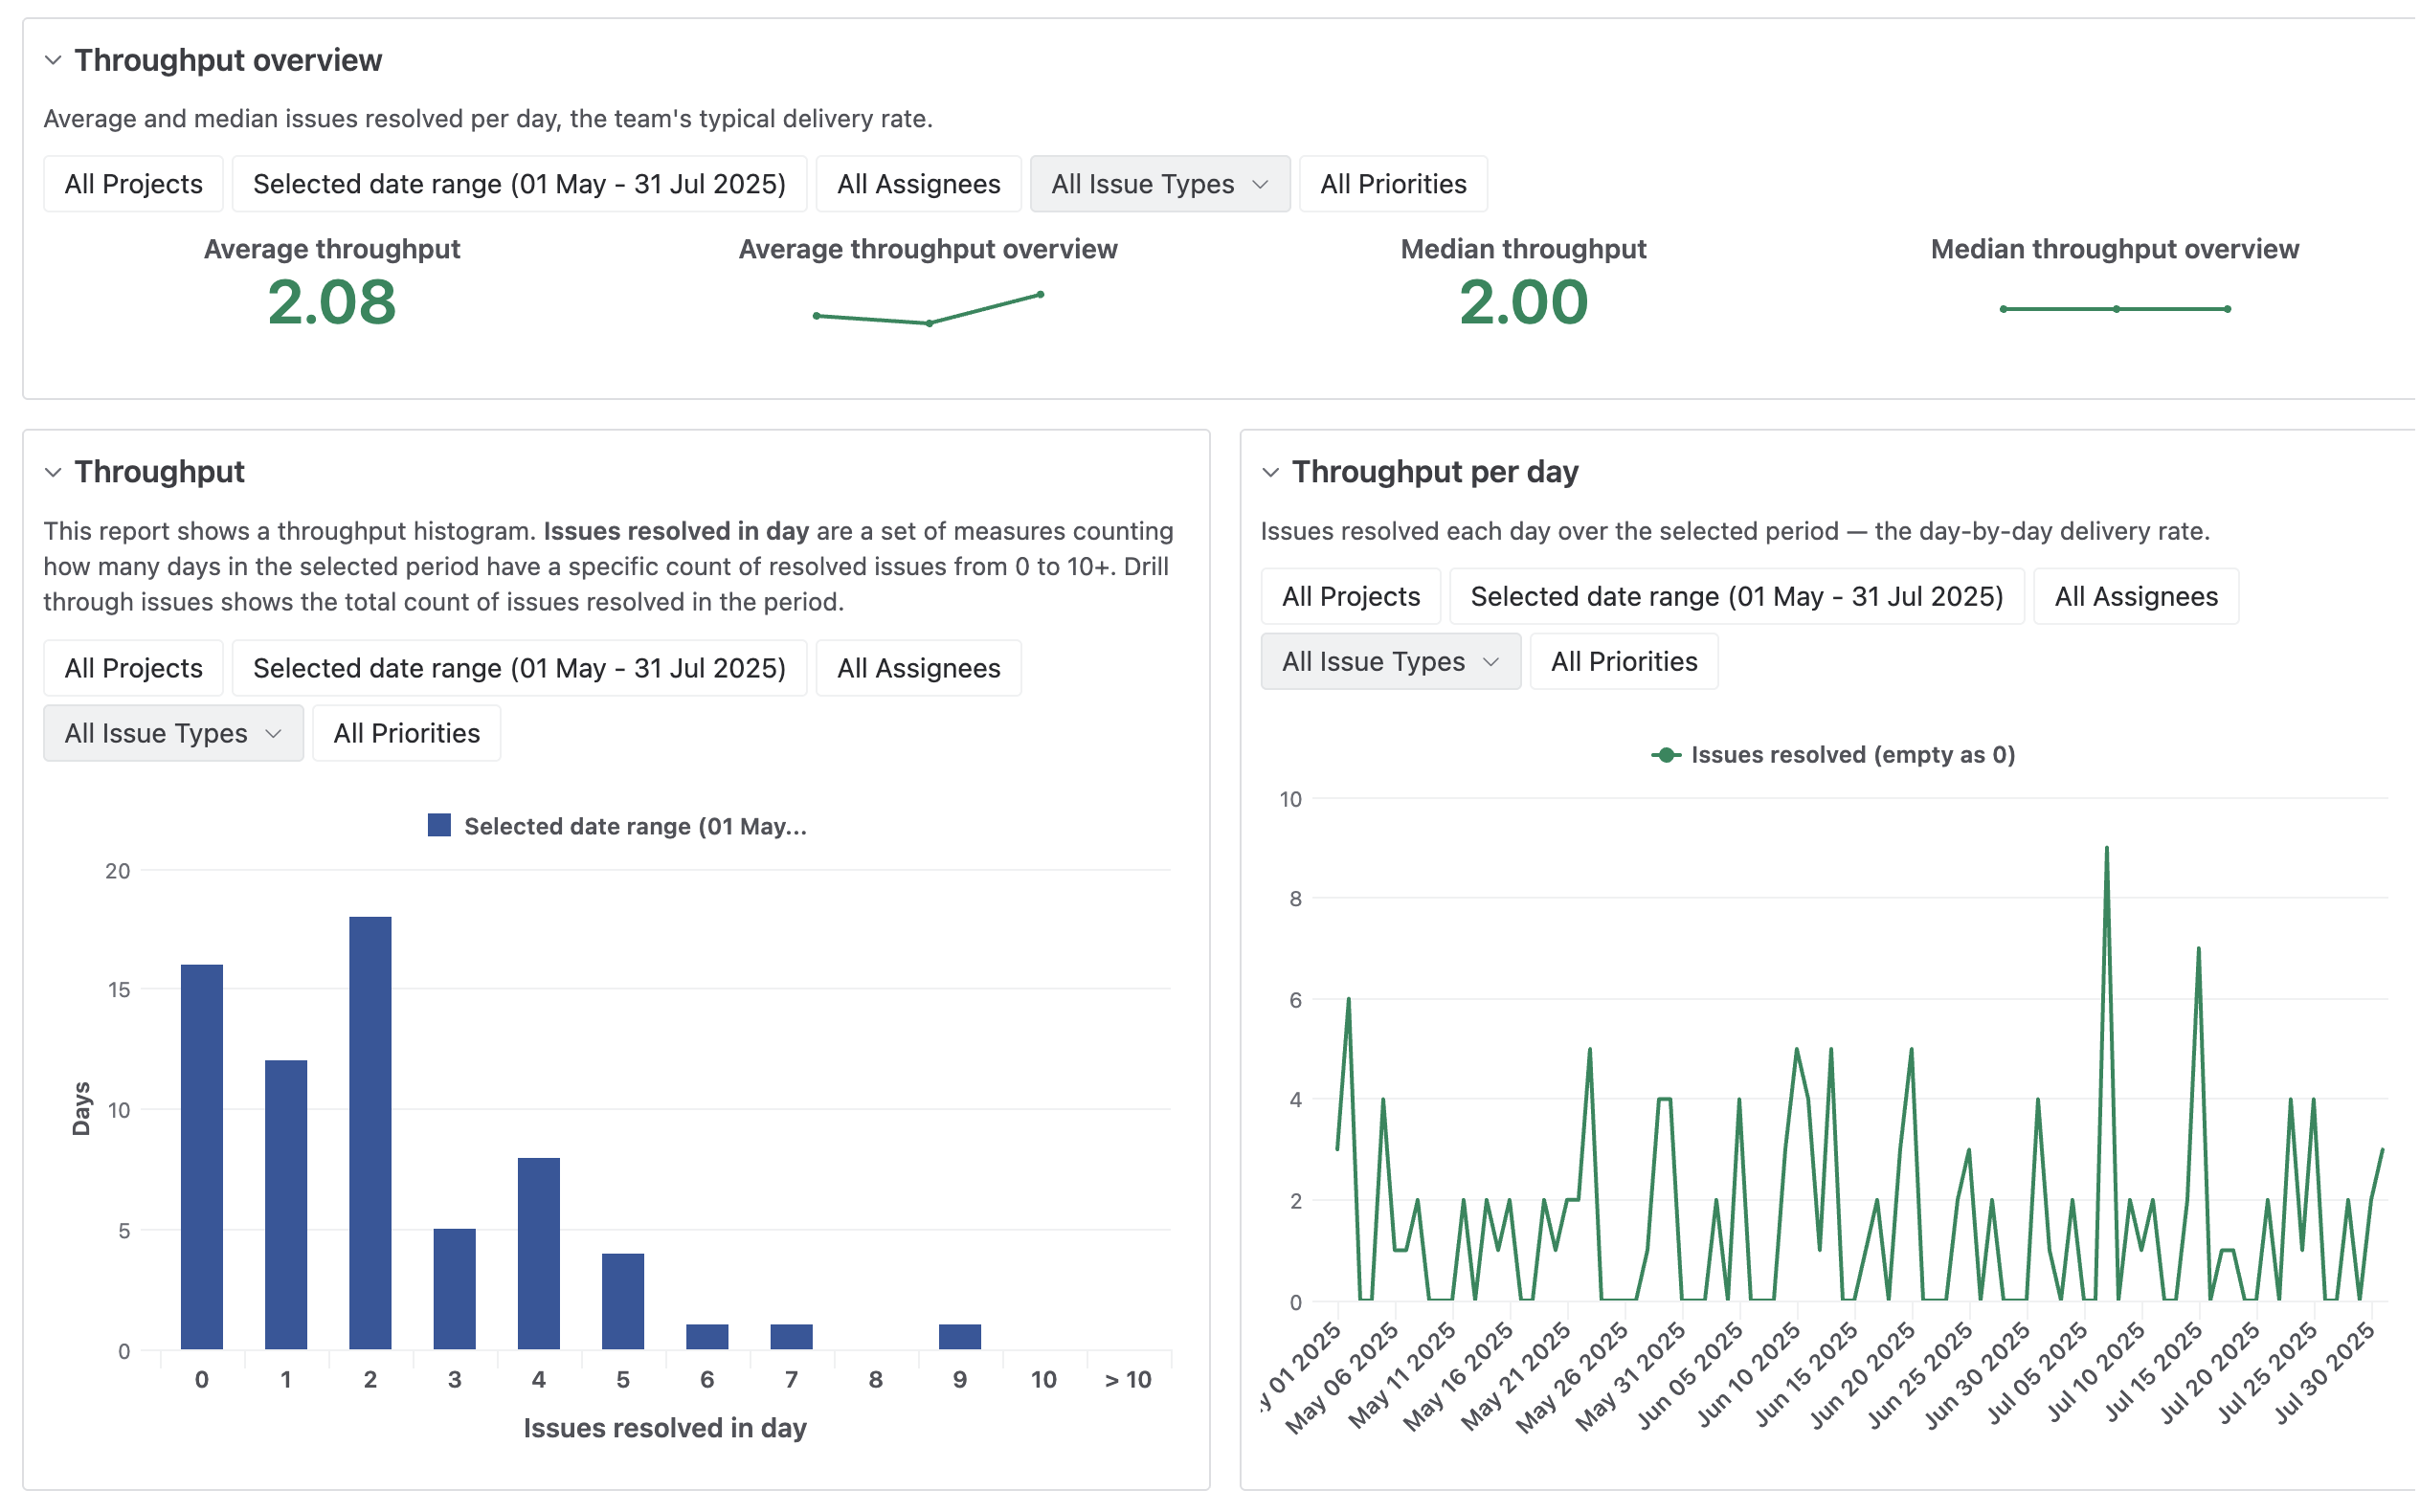
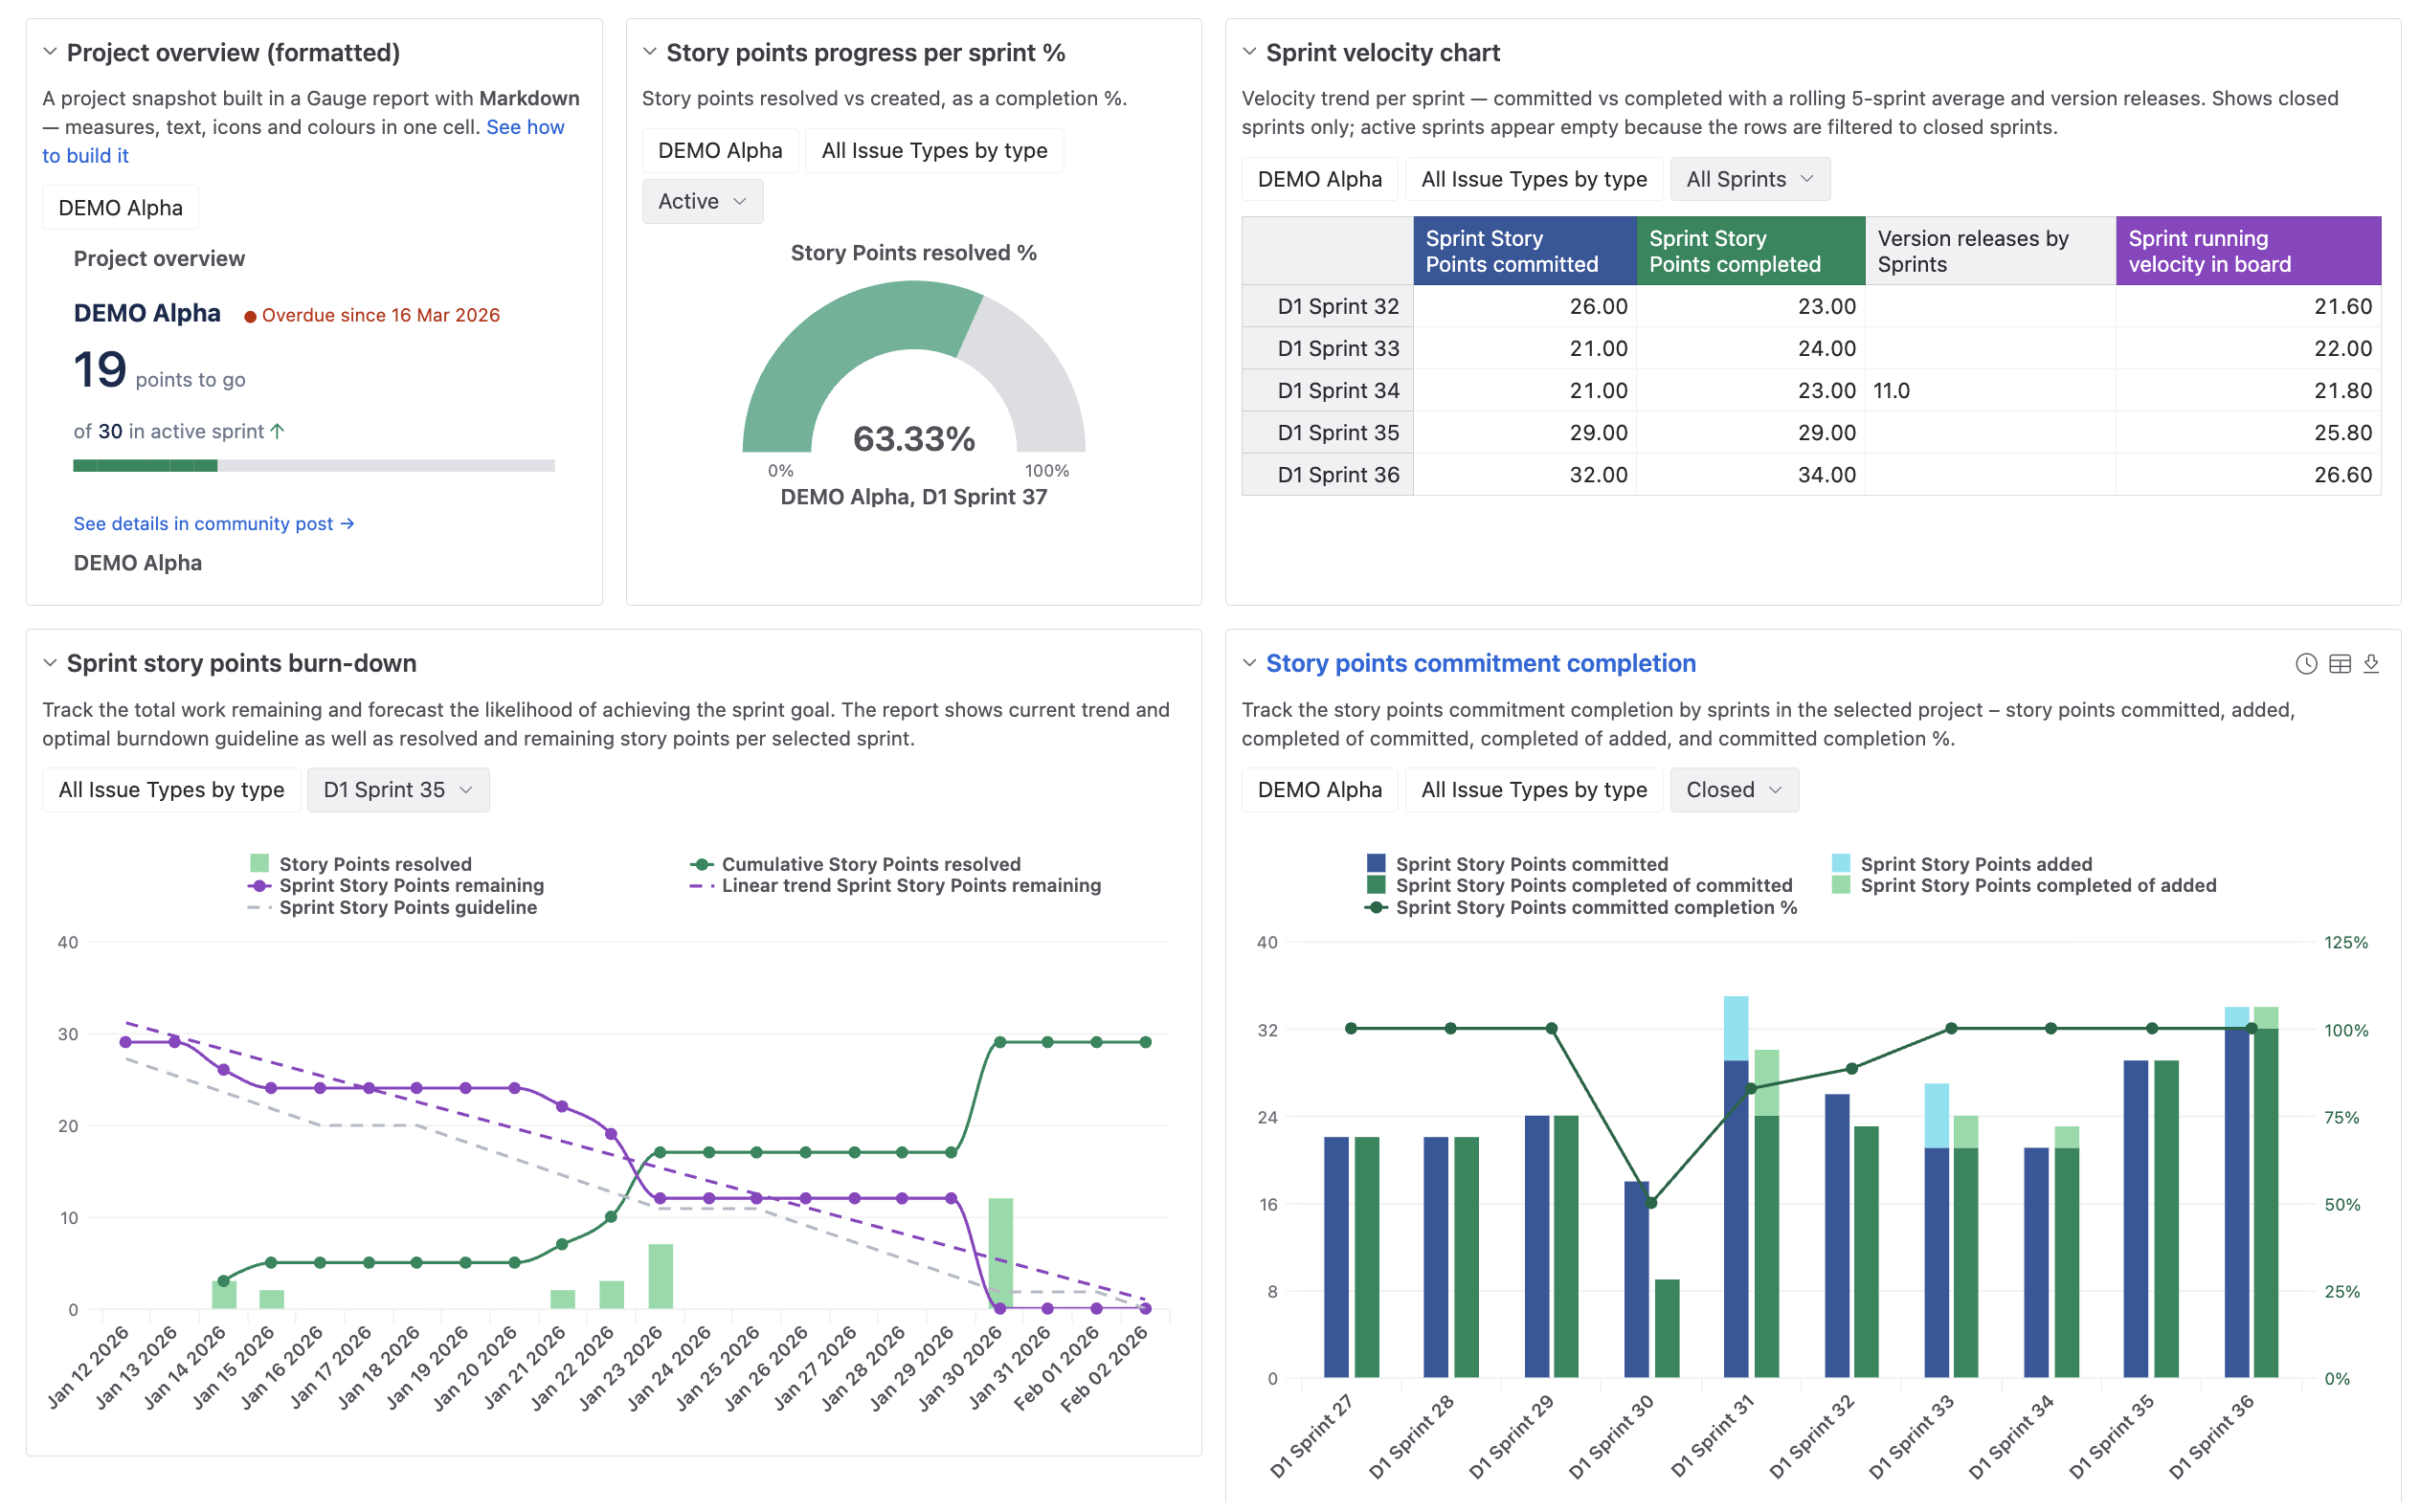
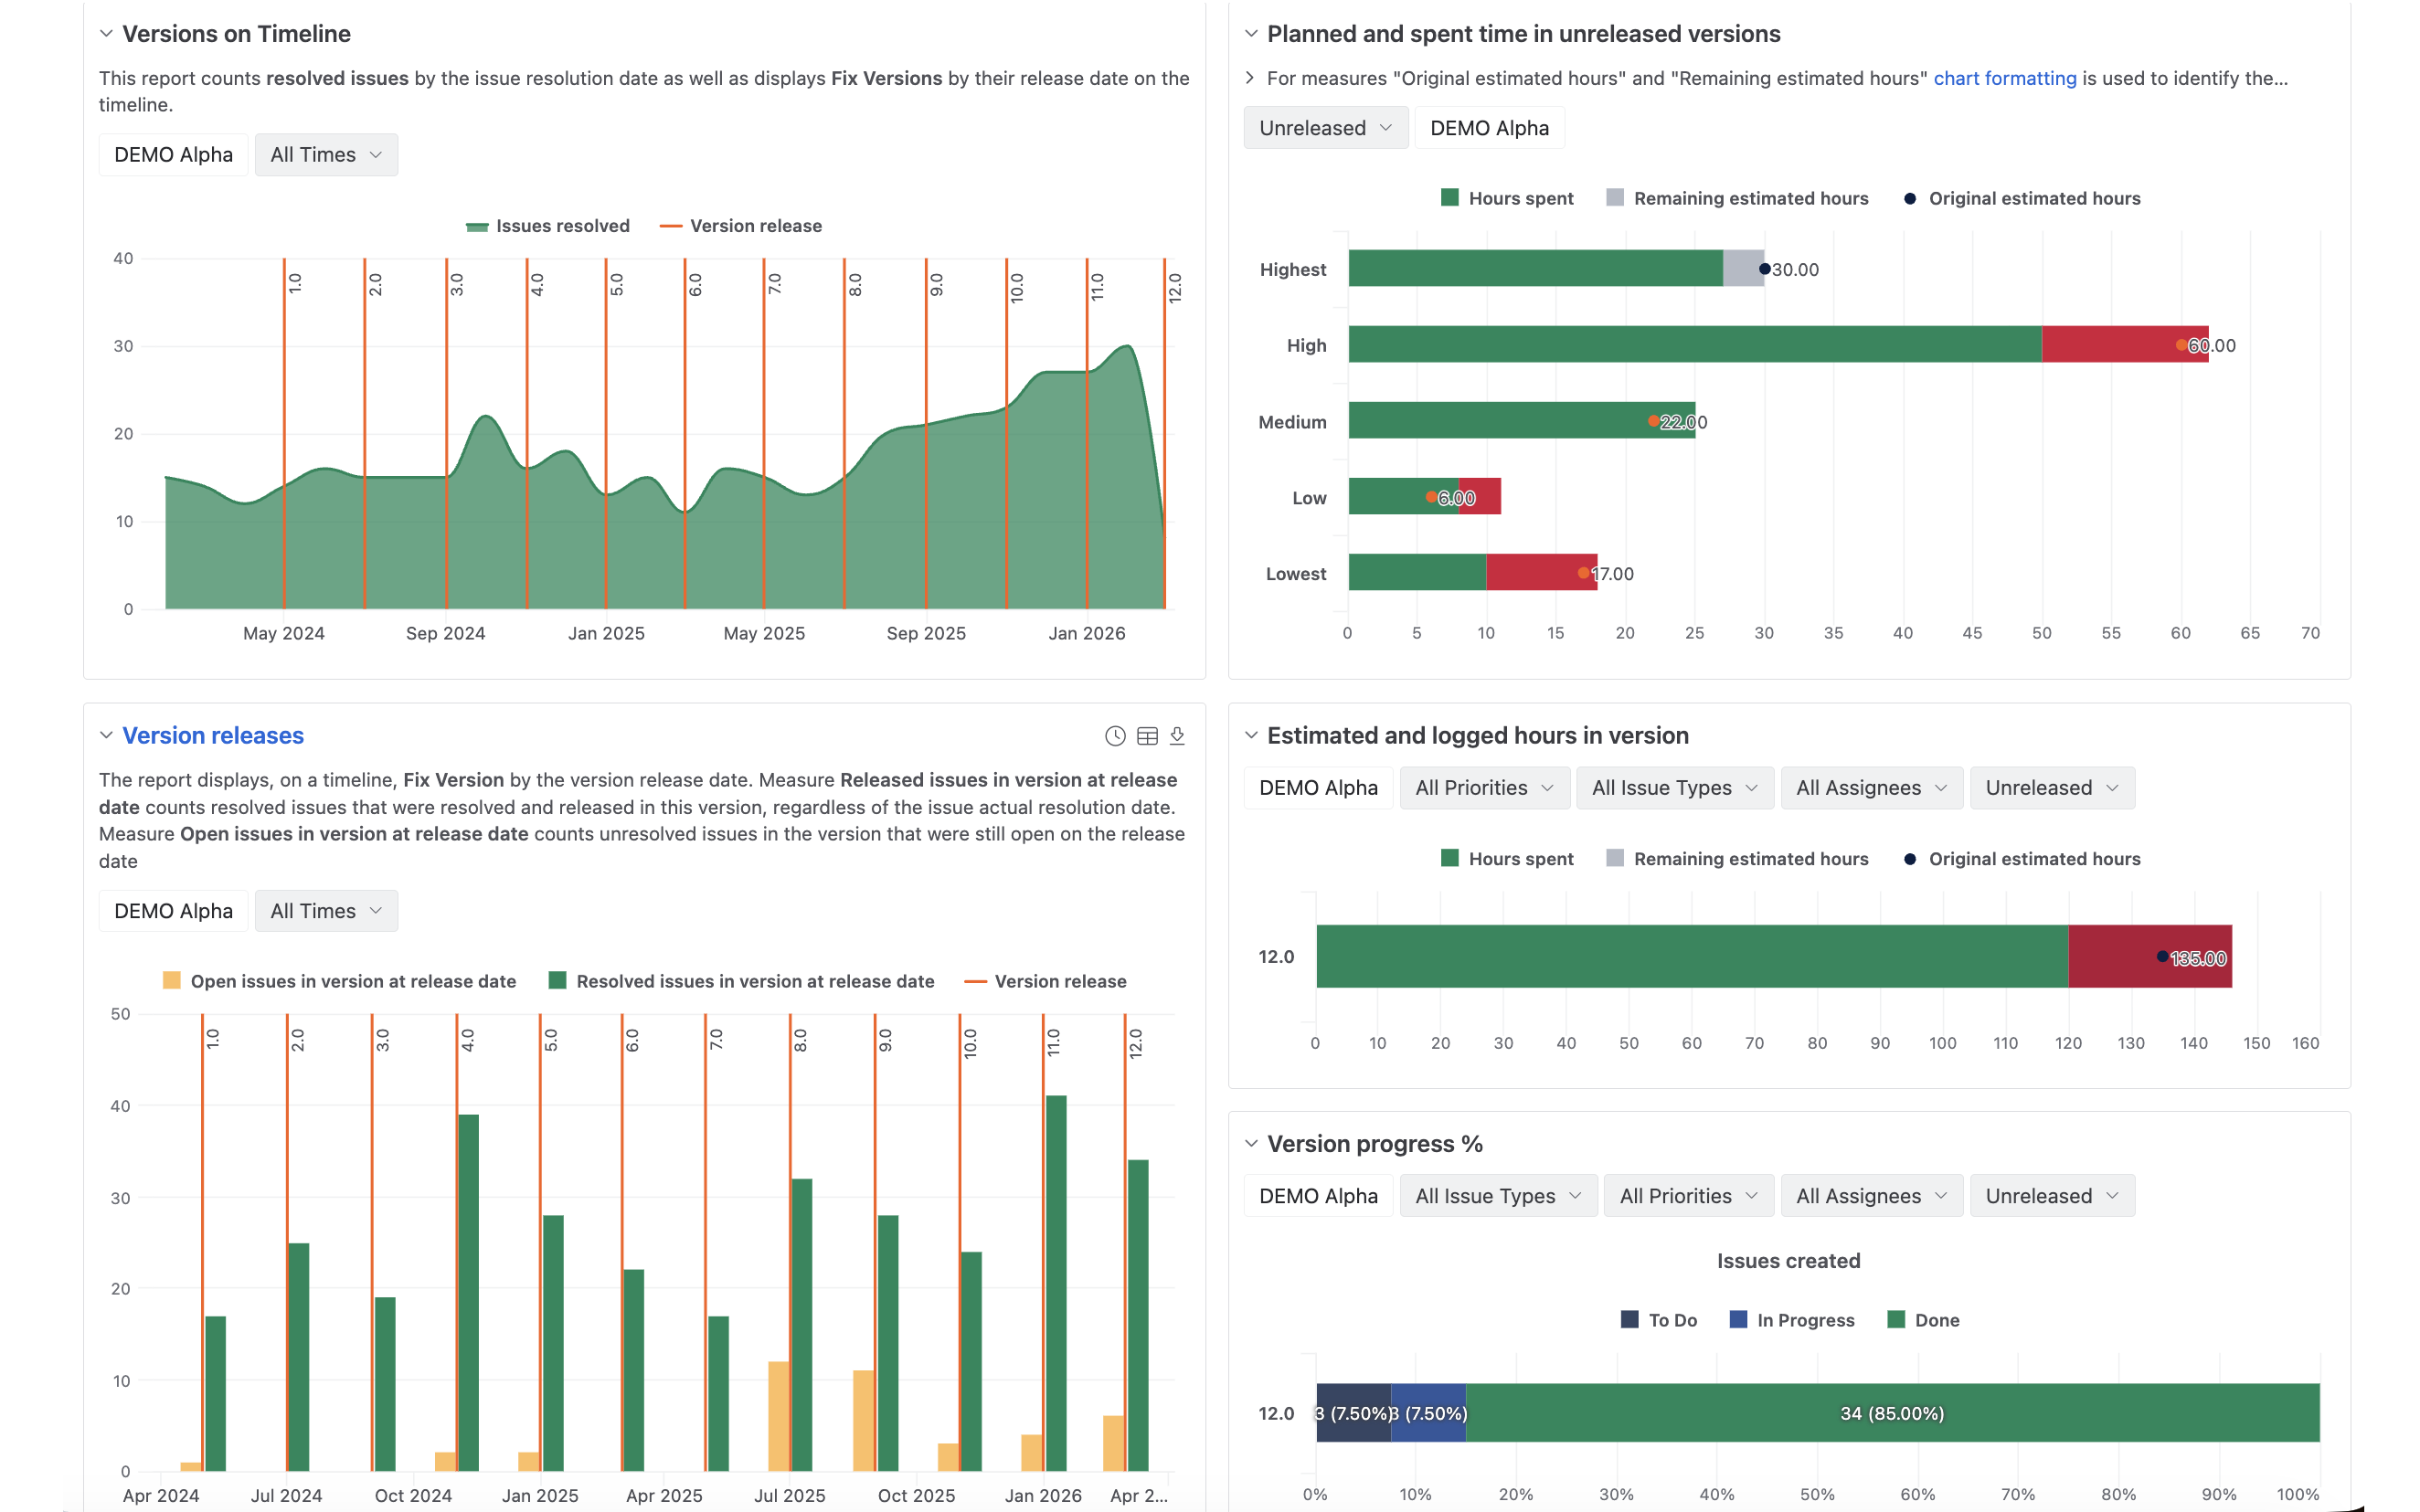
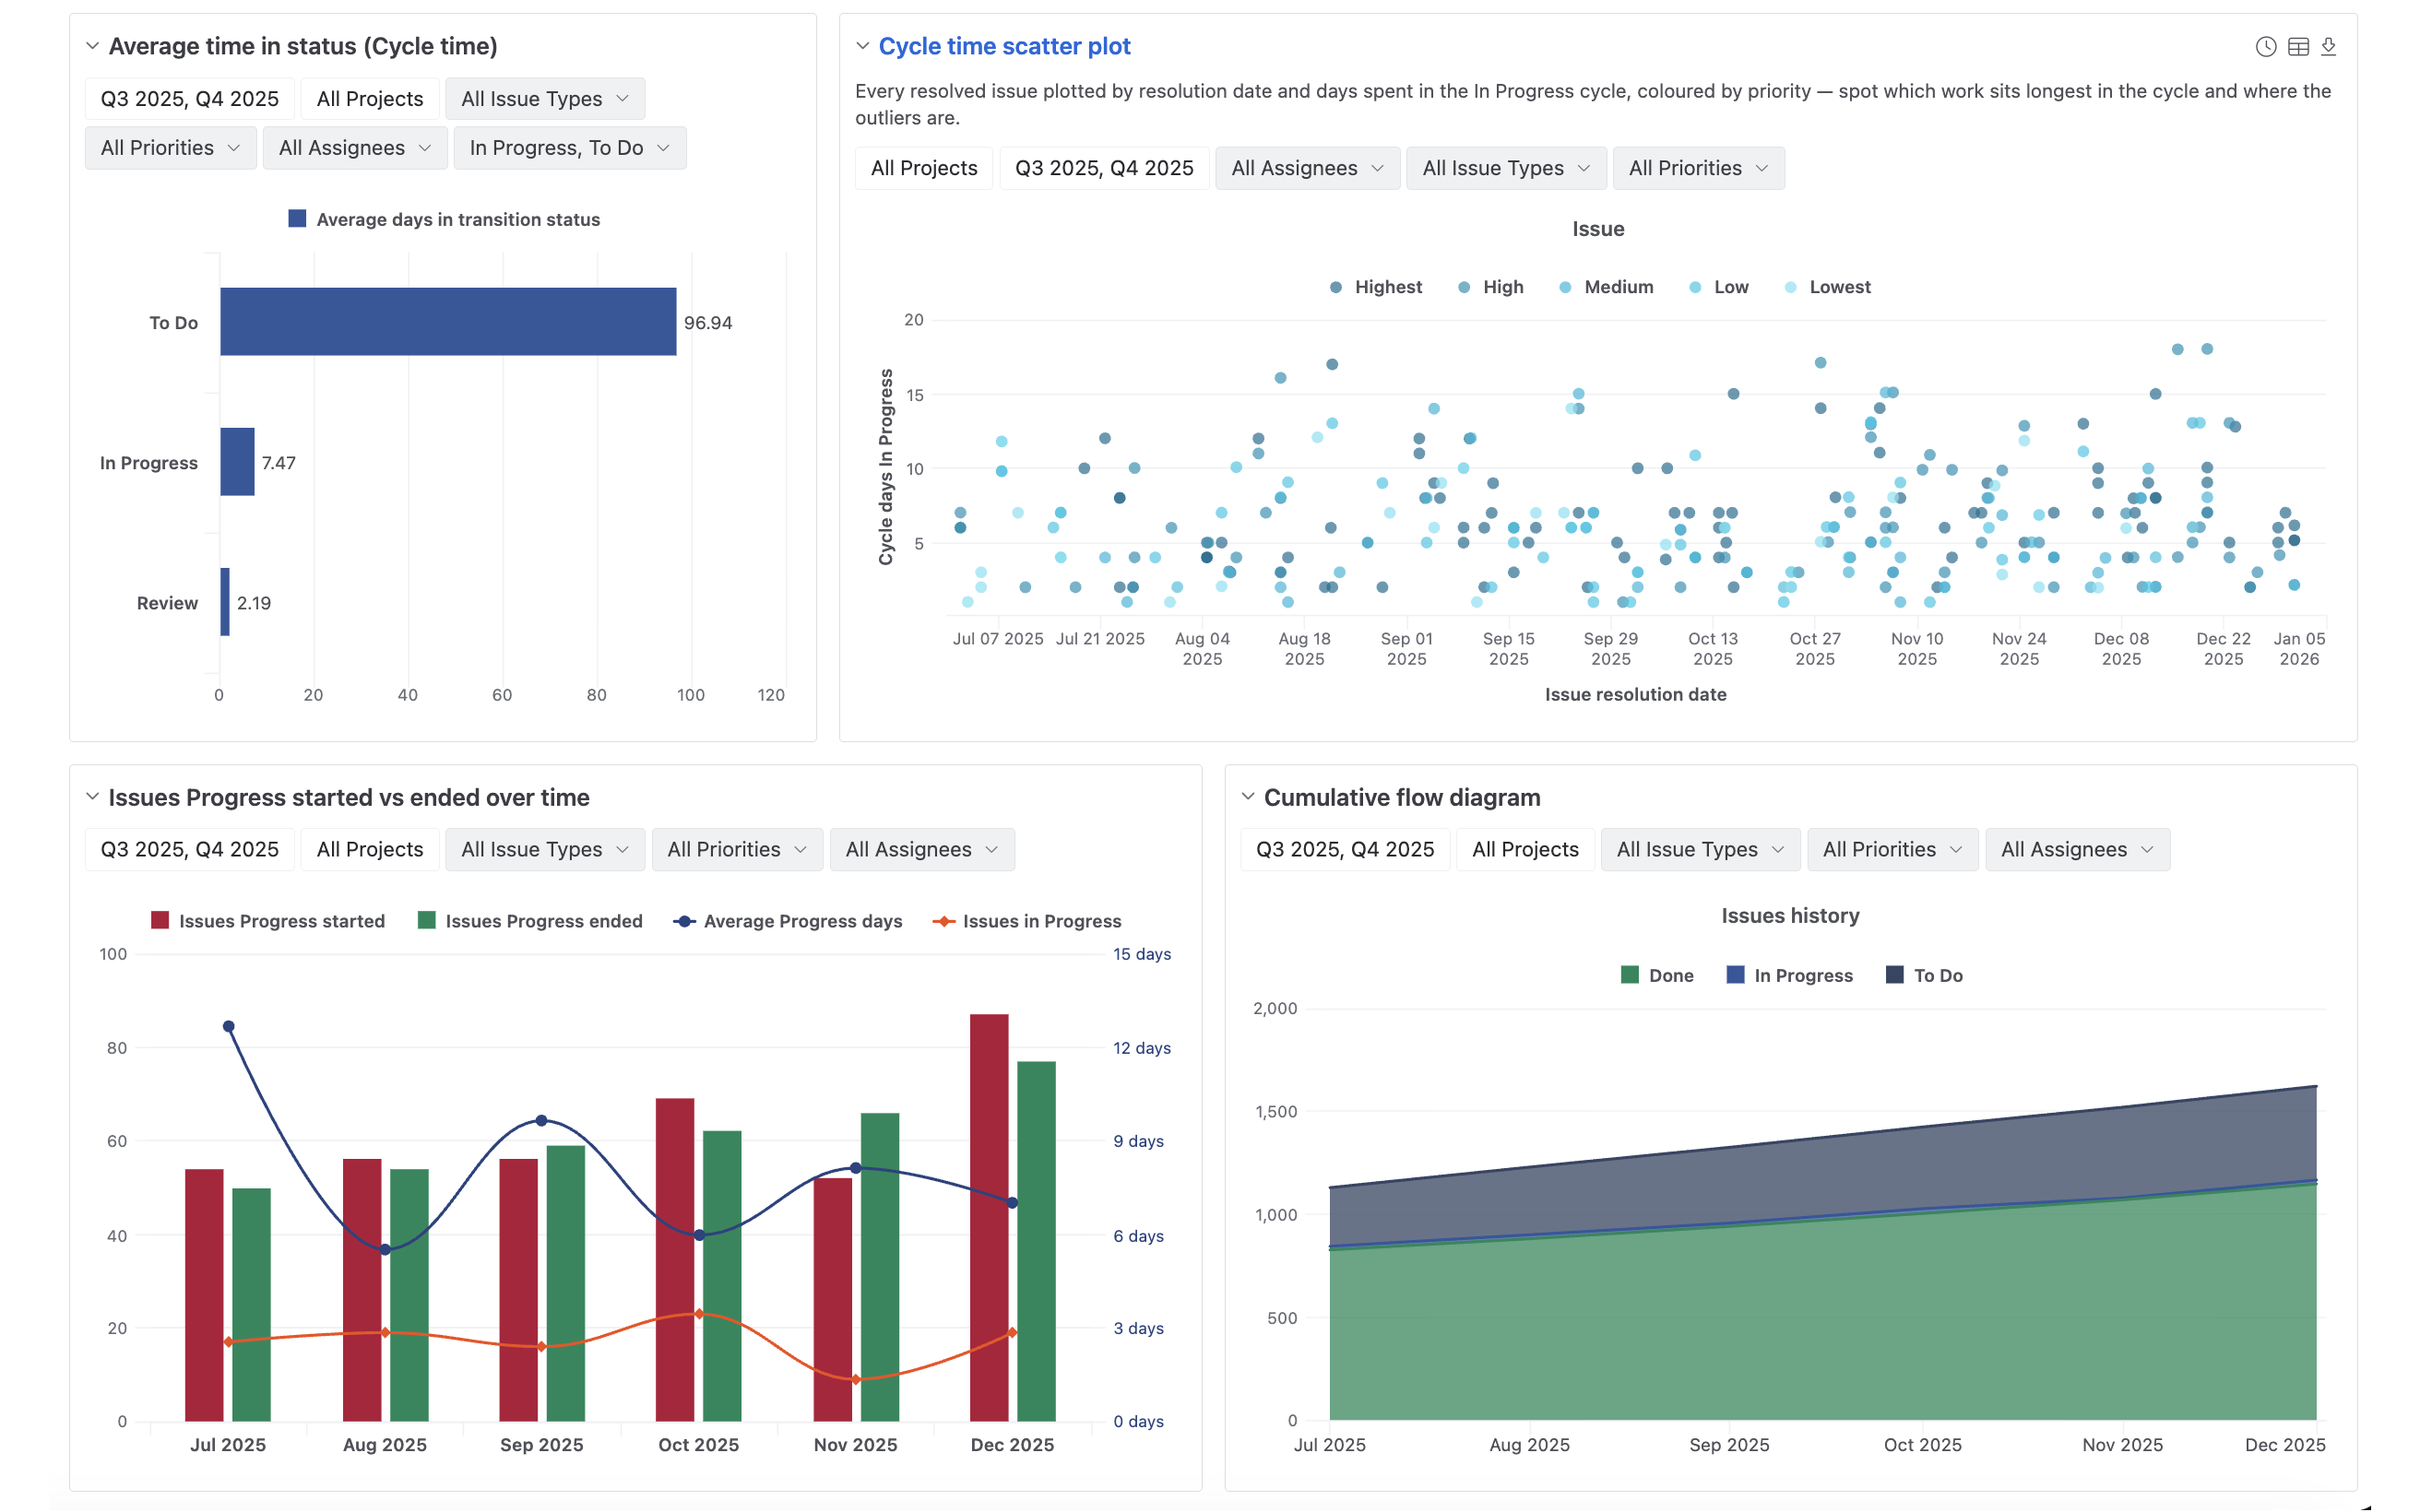
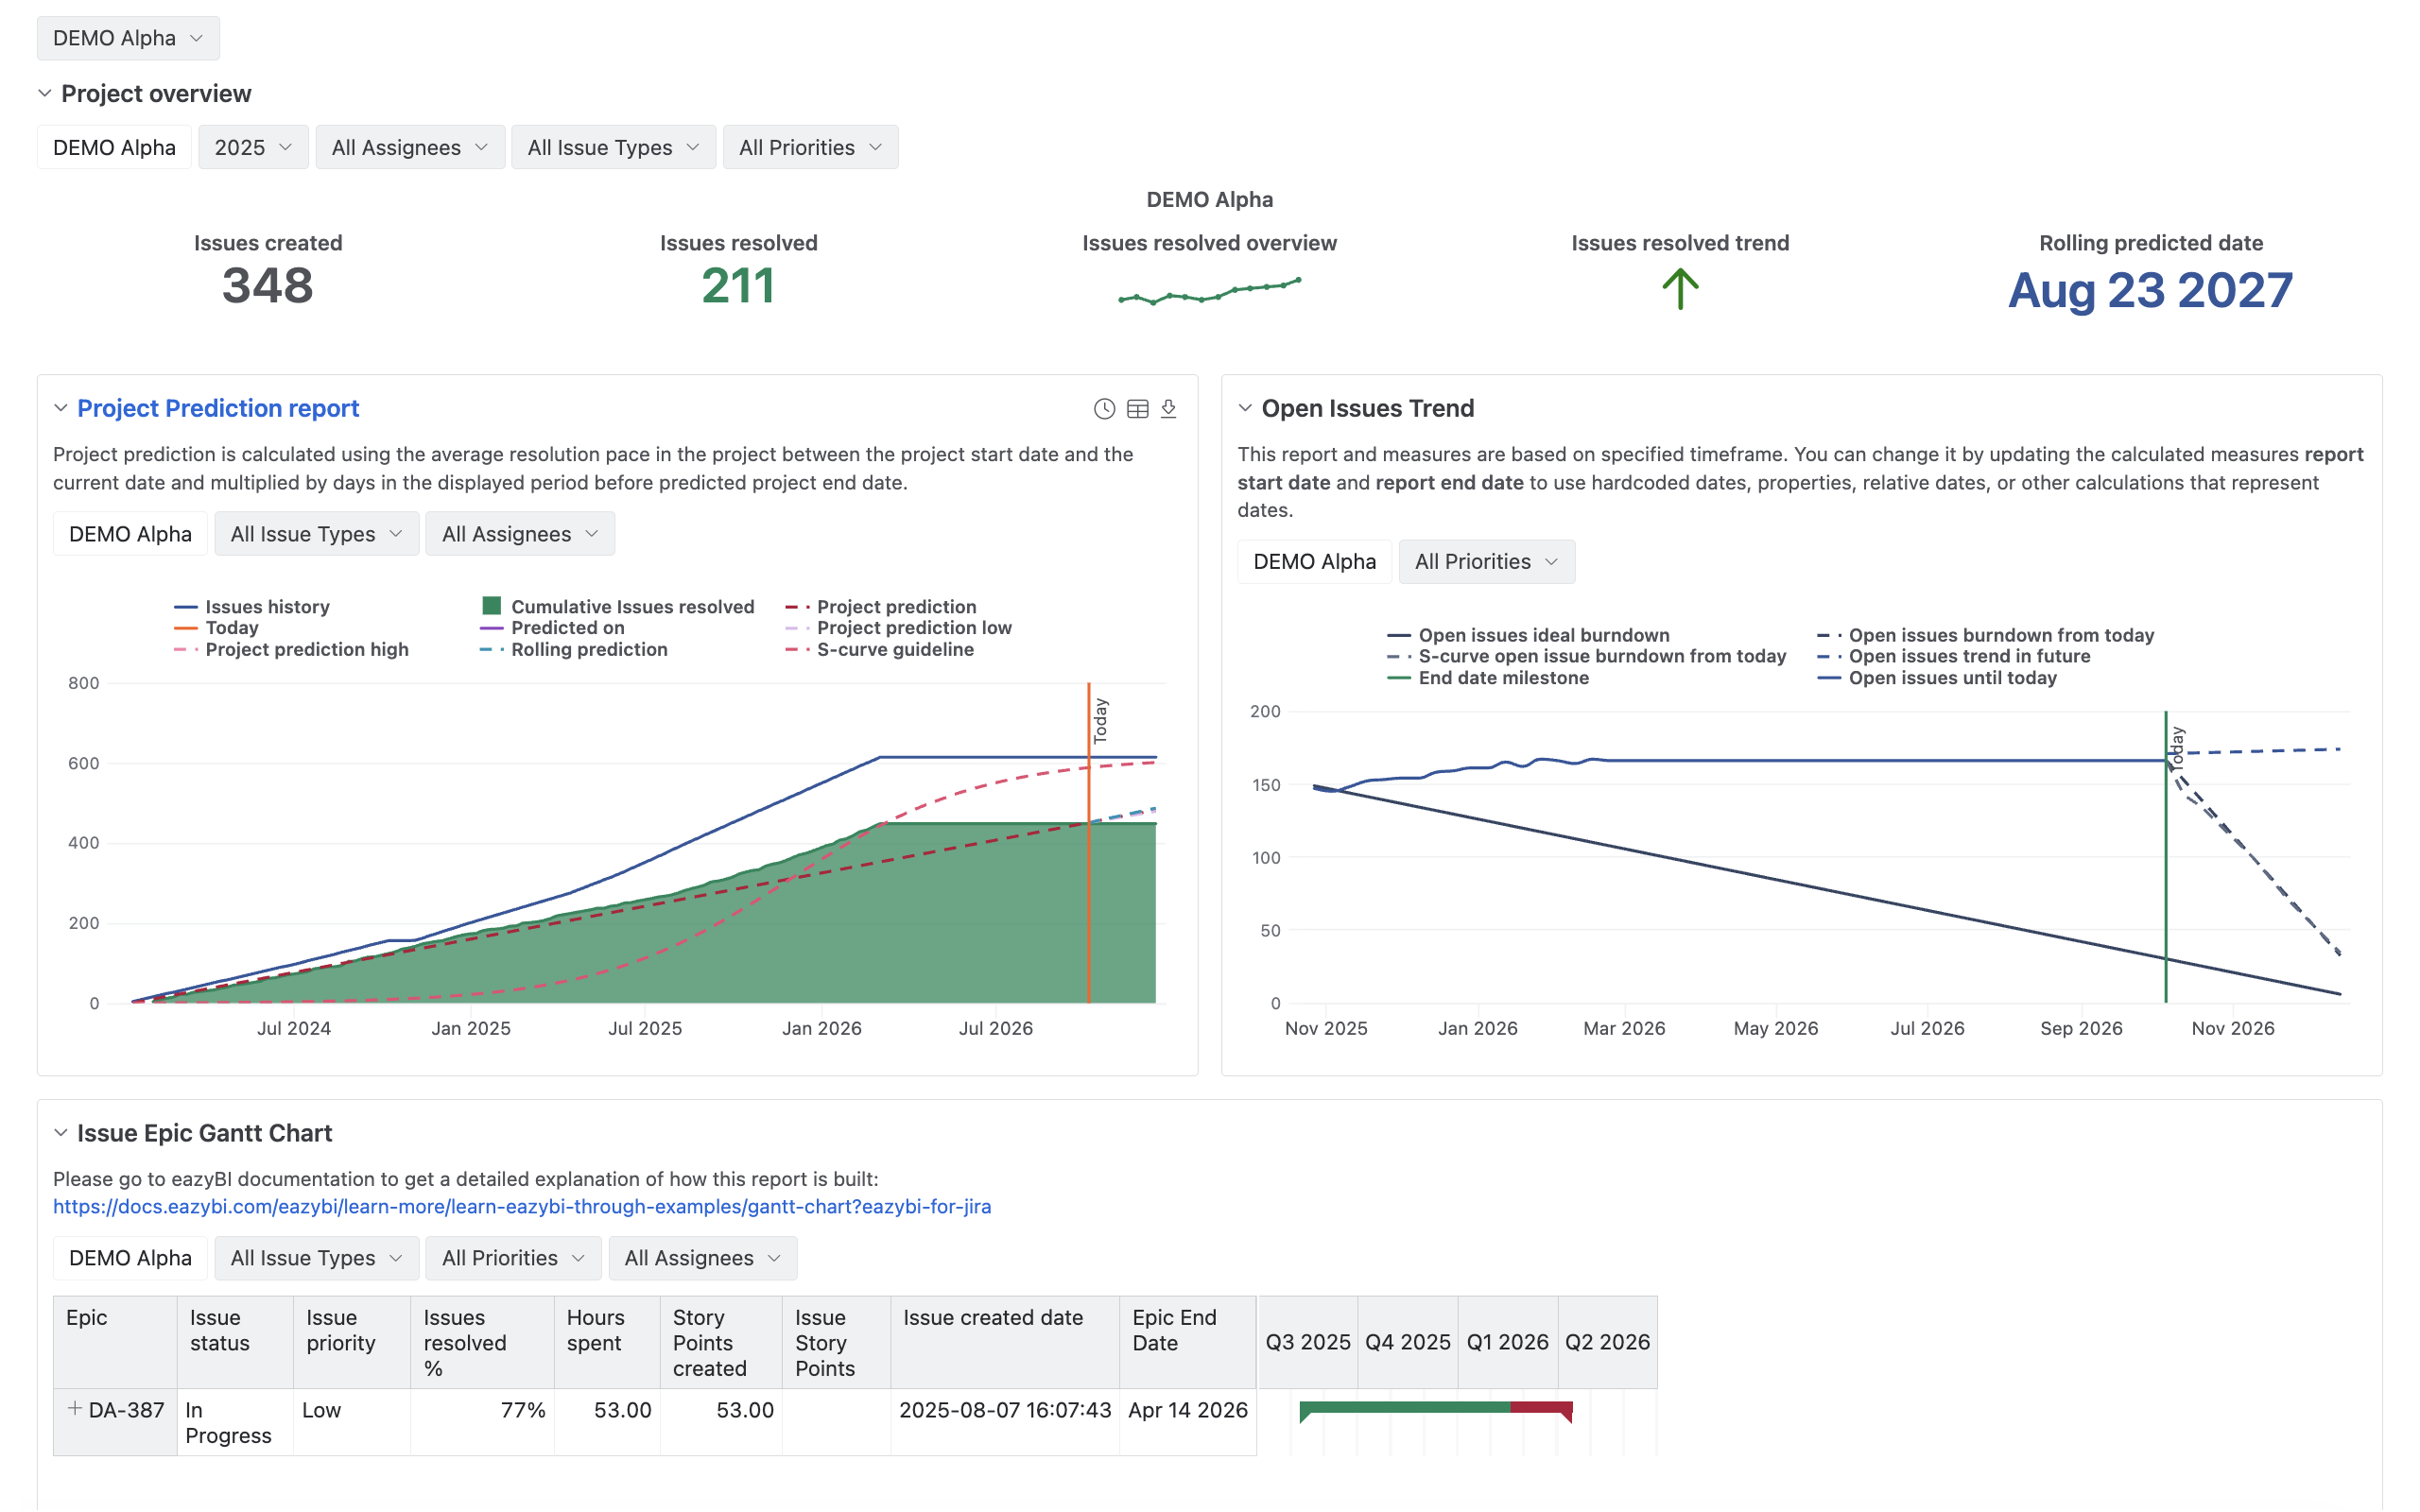
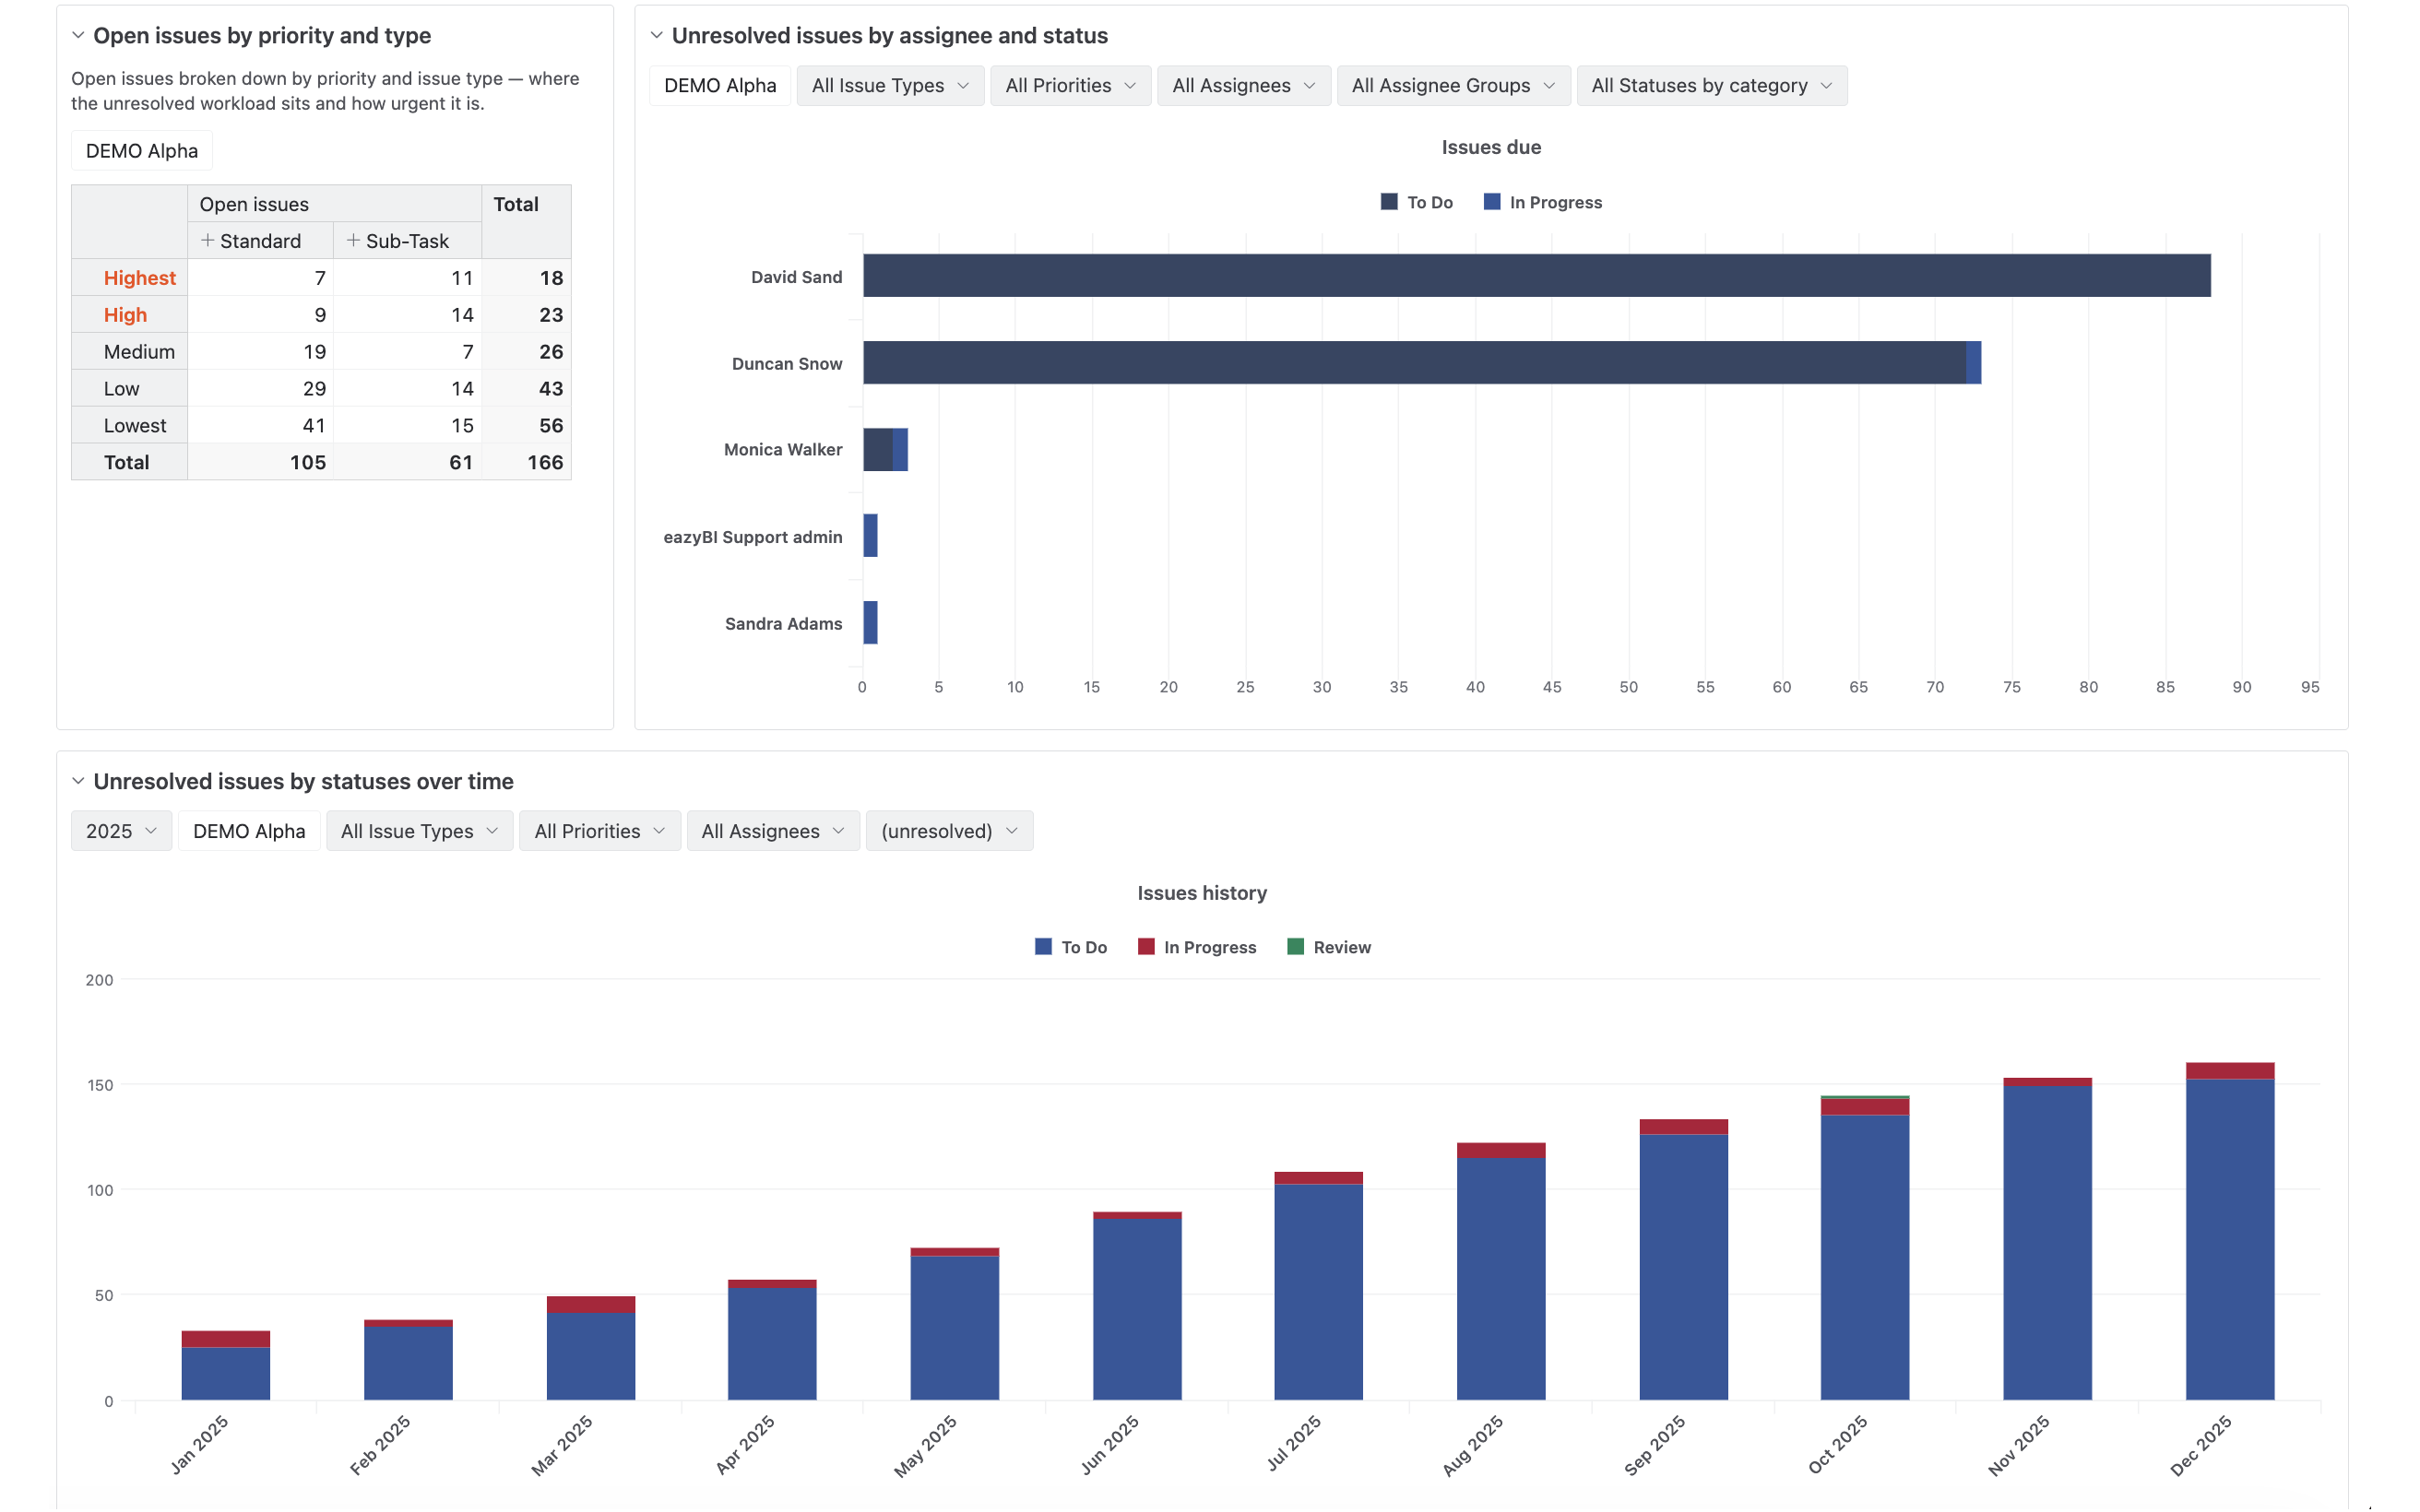
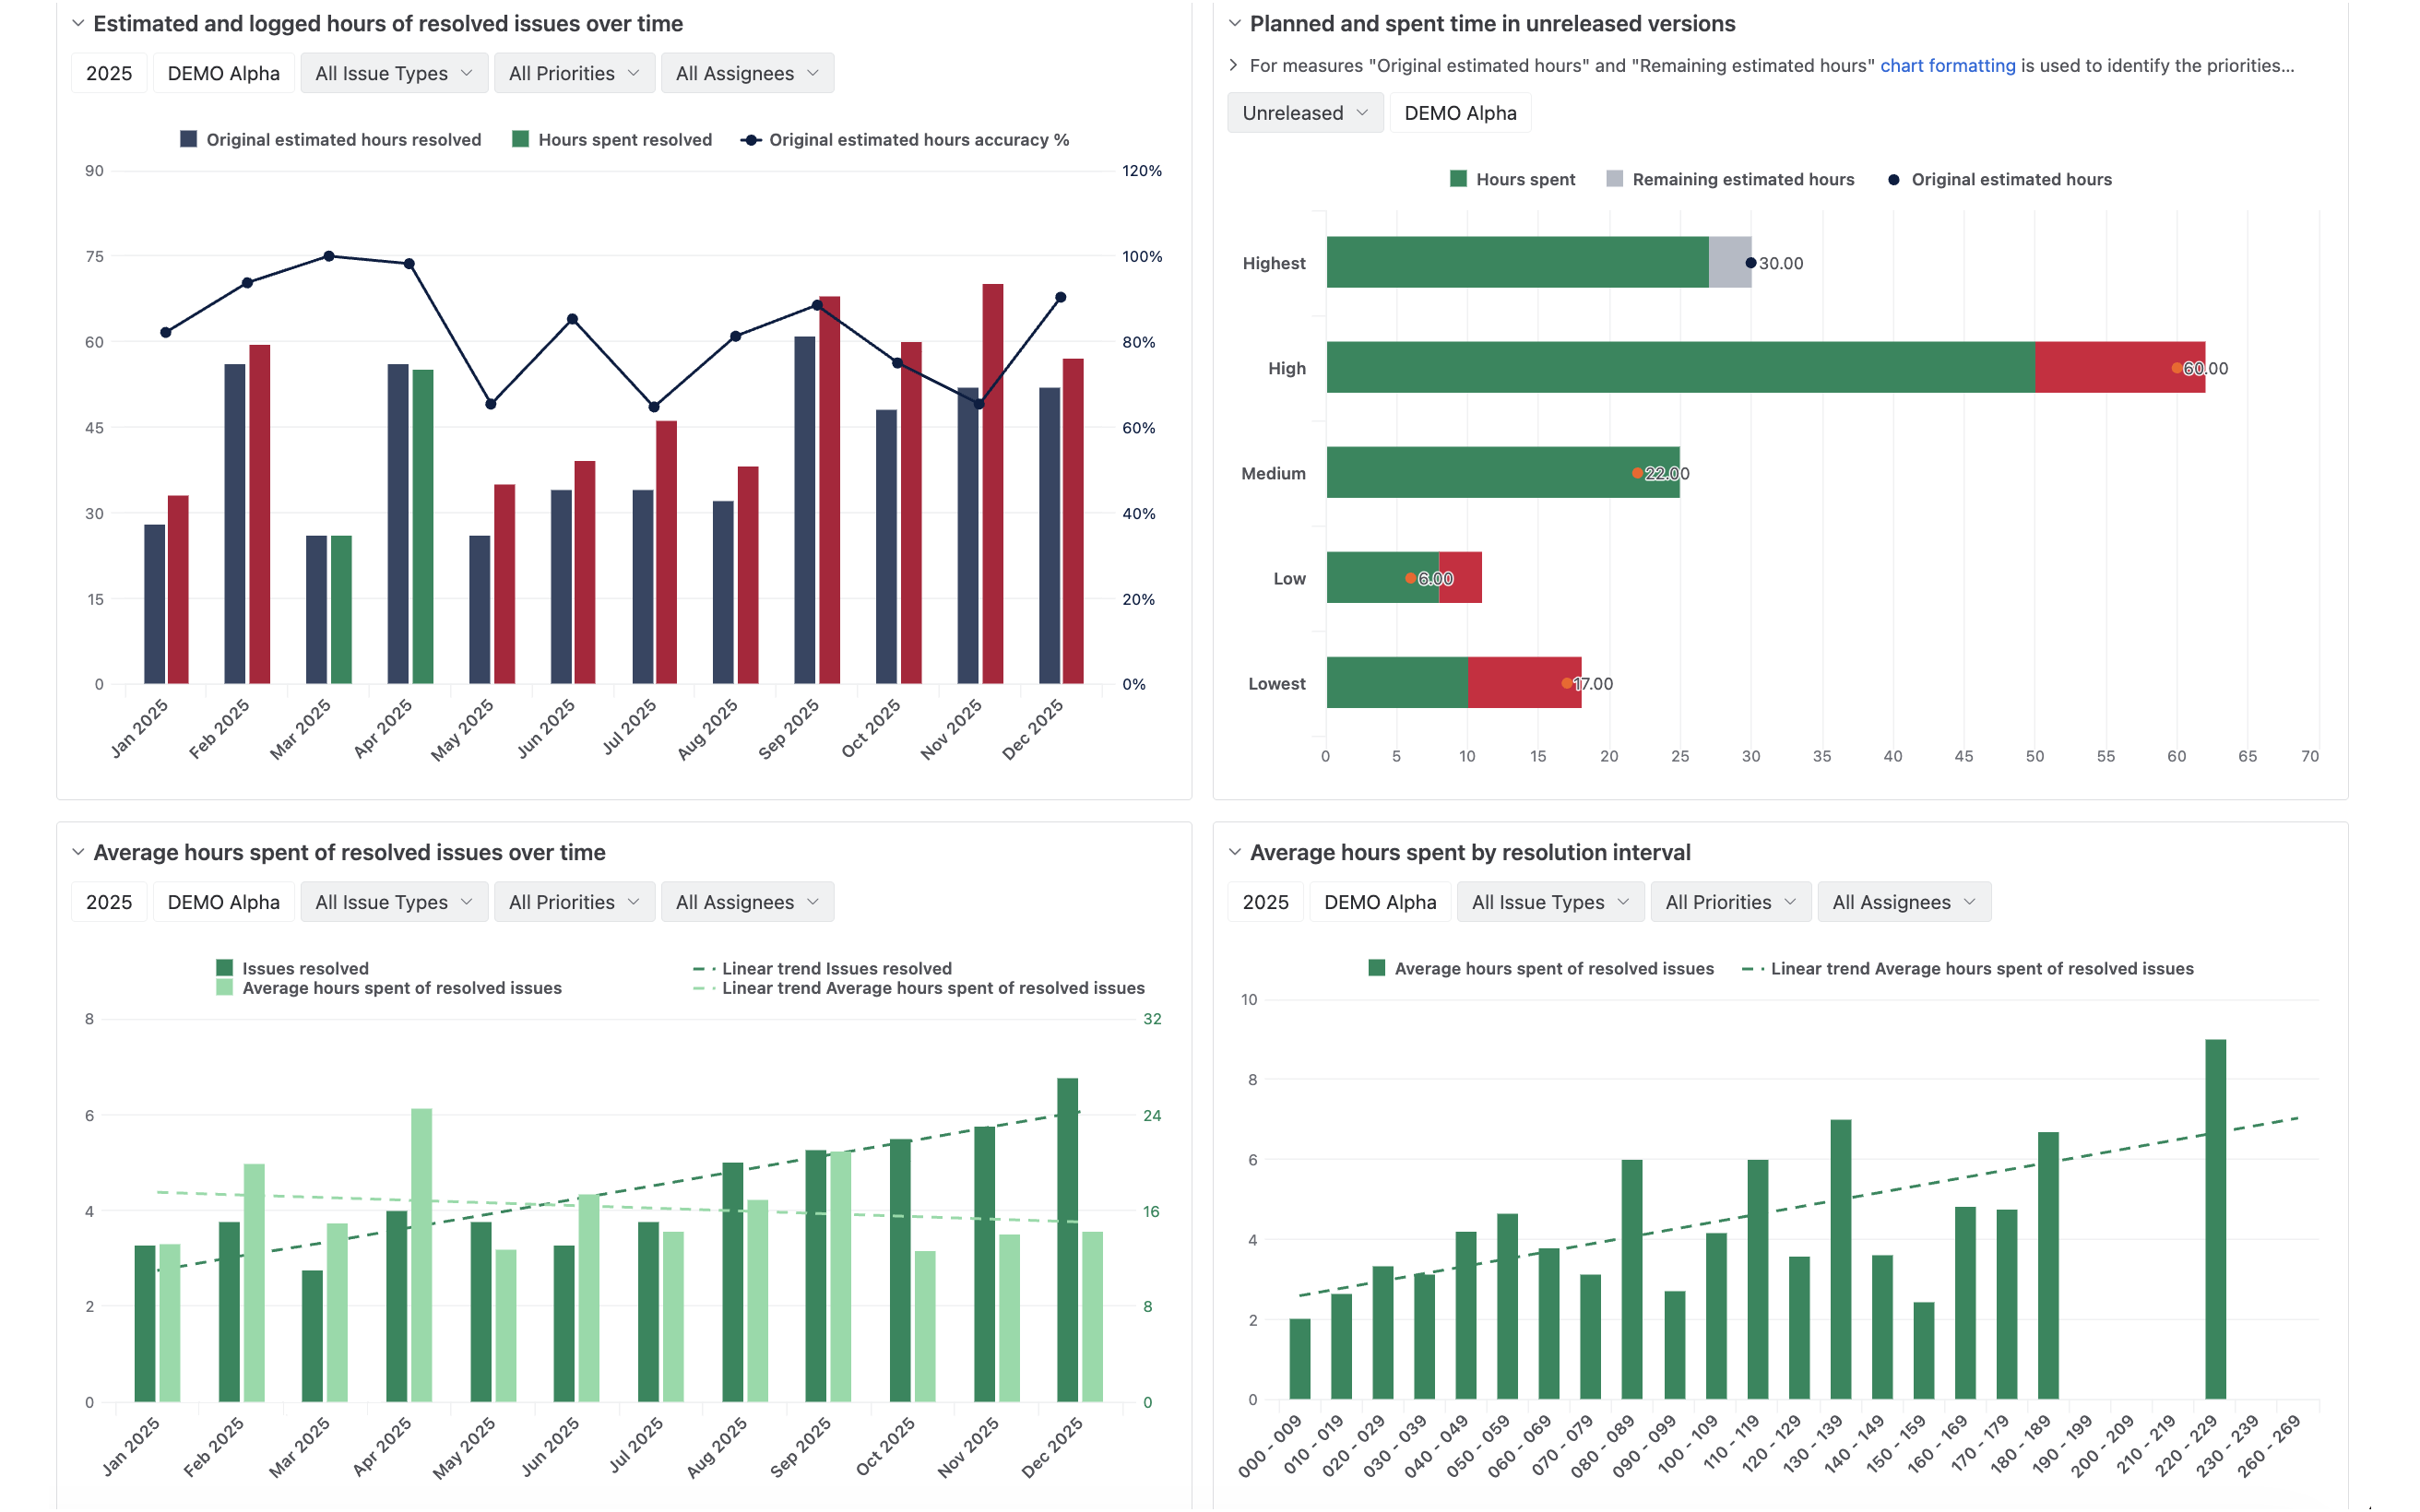
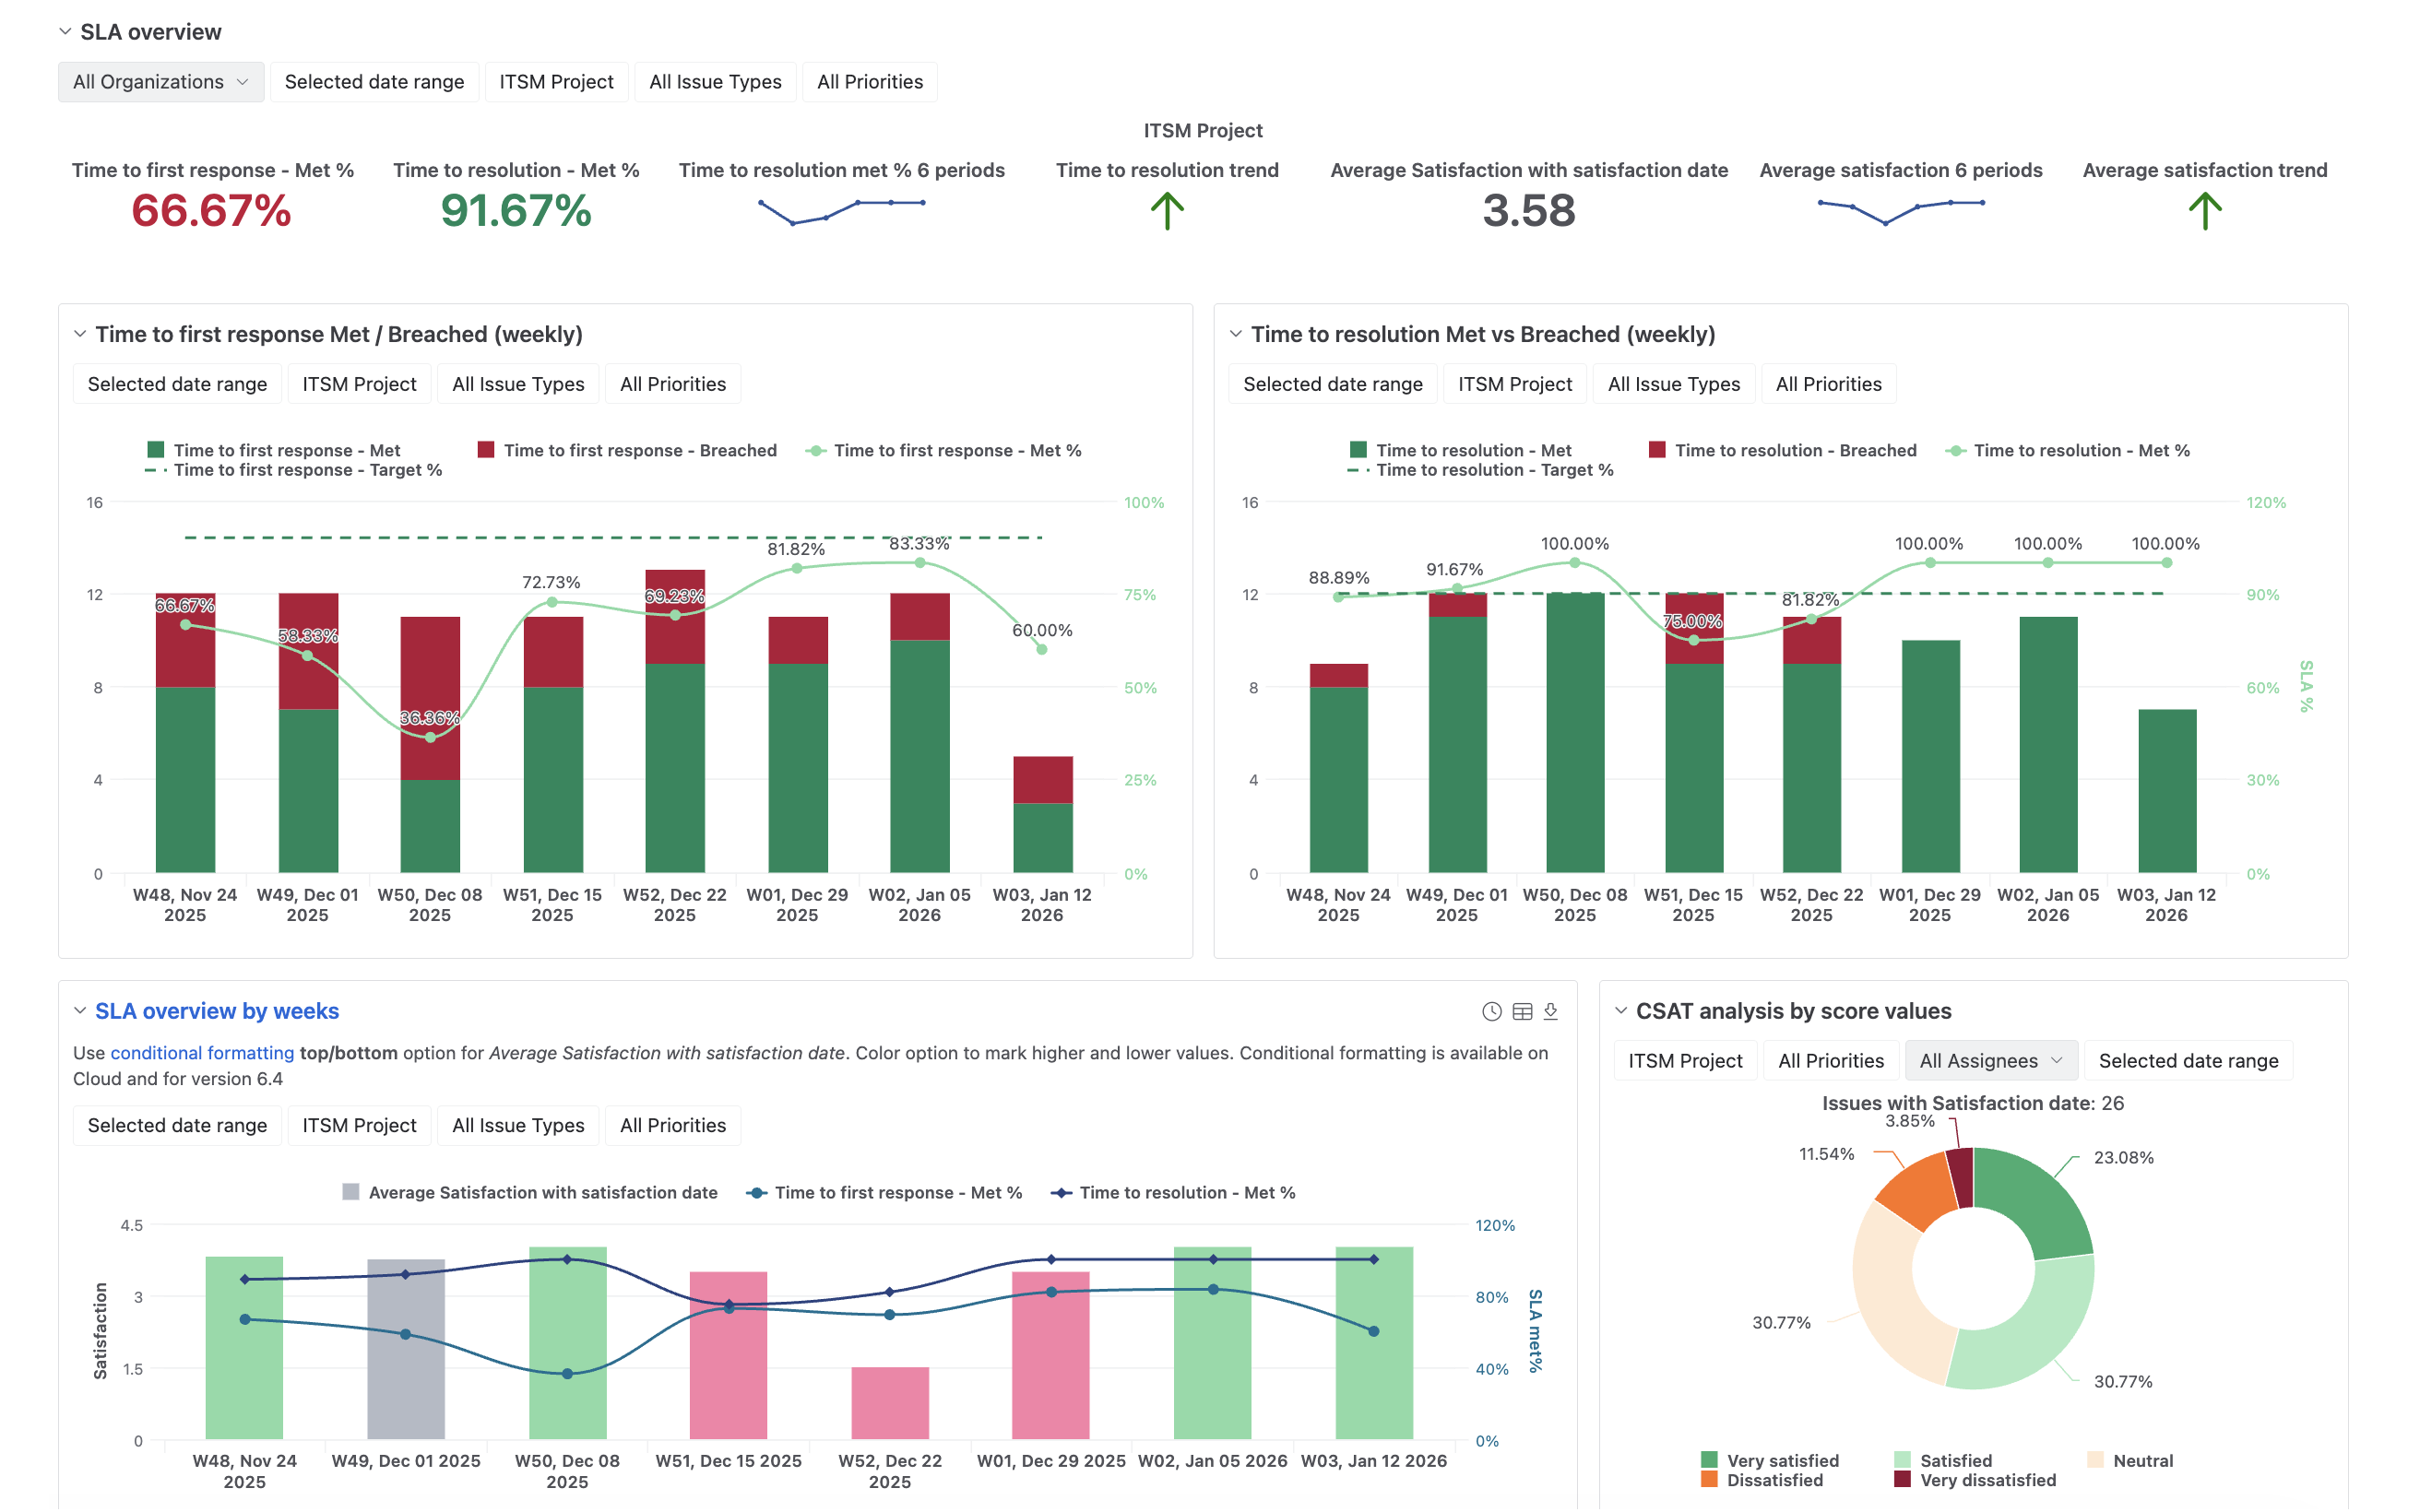
Monitor core project metrics in one dashboard: track created vs. resolved issues, status transitions, and story points. Analyze trends with visual progress charts and review issue priority and resolution times for efficient project management.
Support & resources
eazyBI’s powerful report builder comes with an extensive knowledge base, a vibrant community, and experienced support.
 Support
Top-rated support ready to guide you through your reporting journey.
 Documentation
Detailed documentation with tutorials, instructions, use cases, and how-to videos.
 Community
Active and growing user community with shared experiences and practical solutions.
 Learning Center
Hands-on, self-service lessons to build different reports and grasp BI concepts.
Partner network
Tap into our global network of expert partners for top-tier consulting, solutions, implementation, and training — delivered in your area and language.


eazyBI for Jira pricing & plans
“Excellent product and exceptional support team! Every time we contact eazyBI support, we receive fast, detailed, and professional assistance.”
Frequently asked questions
How long is the free trial period?
When you sign up with eazyBI, you’re automatically enrolled on a free 30-day trial period.
Activating it is a breeze — just log into Jira, paste eazyBI Reports and Charts for Jira in the Find New Apps screen, click on Try it free, and see it installed. And voilà, you’re ready to take your reporting to the next level.
What platforms does eazyBI support?
eazyBI is available on Cloud, and Data Center. While aligned with Atlassian’s cloud-first strategy, we offer the exact same core functionality on all these platforms (Learn more about differences here).
Which license should I choose when purchasing the app?
For Jira, you must purchase the app license that matches the highest Jira application tier. For example, if you have a 500-User Jira Software license, and a 20-Agent Jira Service Management license, your Jira apps must be at the 500-User level.
Cloud marketplace applications naturally match the tier of the host product within the cloud site and are unable to exceed the host product tier.
To find the price of the eazyBI for the Jira license, you can use the price calculator on this page.
Are eazyBI reports real-time?
No. Each JQL search or API request consumes some CPU and memory resources from Jira. Many users performing ad-hoc requests simultaneously could significantly impact Jira’s performance.
eazyBI gathers data via optimized API requests to collect data as quickly as possible with minimal impact on Jira performance. During the import, the data is transformed into an “analytical OLAP data cube”, a data structure that overcomes the limitations of relational databases and provides a rapid analysis of data.
Updates are automatic, usually once per day. On Jira Data Center, updates can occur even hourly or every 10 minutes. You can update data manually at any time or schedule imports to run during off-hours.
Any opened report or dashboard will instantly display the latest imported data, everywhere — in eazyBI, on Jira dashboards, or Confluence pages.
Does eazyBI impact Jira's performance?
Each API request does consume some CPU and memory resources from Jira. However, eazyBI is designed to minimize its impact on Jira’s performance.
- eazyBI gathers data through optimized API requests that collect data as quickly as possible with minimal resource usage.
- eazyBI imports data incrementally, to further reduce the impact. Only new and updated issues are imported, and the import process usually takes just a few minutes.
- For larger instances, imports can be scheduled during off-peak hours to avoid any significant performance disruptions.
In Jira Cloud, eazyBI report processing is handled in the powerful eazyBI Cloud data centers, ensuring that there is no additional impact on your Jira Cloud instances.
For Jira Data Center users, eazyBI can be run in a separated child process with dedicated memory and process handling, or even on a separate dedicated node, significantly reducing its footprint on Jira’s overall performance.
What is the MDX query language used in eazyBI? Do I need to know it?
MDX, or MultiDimensional eXpressions, is a universal standard developed by Microsoft for querying analytical data cubes efficiently. In eazyBI, MDX plays a crucial role in enhancing the flexibility and depth of data analysis.
While knowing MDX can significantly enhance your reporting capabilities, it is not a requirement for using eazyBI. You can build powerful custom reports without delving into custom MDX calculations. To get started, we recommend checking out the “First Steps With eazyBI” article or watching our tutorial on “How to create smart reports without MDX”
Just like formulas in Excel, using MDX makes your reporting much more powerful, offering limitless possibilities for data exploration and insight generation. Whether you choose to use MDX or not, eazyBI provides all the tools necessary for effective data analysis and reporting.
Are there any resources available on how to utilize the tool?
Yes, we have vast help & support resources available across different channels:
- Our extensive knowledge base includes detailed setup articles, how-to videos, webinars, use case examples, and presentations from the team and customers.
- You can reach out to our Support team via Contact with any technical or reporting questions.
- Speak to the active eazyBI community online.
- Get a vetted eazyBI partner via Partners to advise you on the best reporting structure and create it for you.
- Take self-paced learning courses in the eazyBI Learning Center.
Is our data safe with eazyBI?
Absolutely. eazyBI is SOC 2 Type II certified and was built with security best practice in mind (see our privacy policy here):
- Data is encrypted during transit and at rest.
- Account-specific data imports are stored in a separate database schema, isolated from other eazyBI accounts.
- eazyBI for Jira Data Center data is stored on our customers’ servers. We don’t use any external hosted services.
- eazyBI for Jira Cloud is hosted on Google Cloud Platforms. We take care of provisioning, monitoring, and managing virtual servers, as well as providing support to our subscribers. Customers can choose their data residency location from one of the following:
- Europe (EU) europe-west1 data center in Belgium.
- United States (US) us-east4 data center in Virginia, US
- Australia (AU) australia-southeast1 data center in Sydney, Australia
- All incoming web requests are authenticated and authorized before gaining access to an account, as well as logged in the Jira server log directory so you can trace all user activity if needed.
For more information, read our Security page or contact us.