eazyBI Cloud — Easy Business Intelligence for Project Teams
Web-based self-service Business Intelligence in the Cloud — no servers, no setup, no hassle. A scalable, easy-to-use SaaS analytics solution for growing teams. Always up-to-date with the latest features, improvements, and fixes.
Cloud-Based Reporting—Better Tracking, Planning, Execution, and Forecasting
- Measure and analyze your project and business KPIs.
- Reduce estimation errors or ineffective resource allocation.
- Prevent major mistakes from happening and repeating.
- Identify trends, threats, and opportunities.
- Keep teams informed, productive, accountable, and responsible.
- Optimize and improve work-flows, processes, and procedures.
- Make well-informed, smart, data-supported decisions.

Many Data Sources
Import your data from popular web applications, databases, or files.

Learn more

Learn more

Learn more

Learn more

Learn more

Learn more

Learn more

Learn more

Learn more

Learn more

Learn more

Learn more

Learn more

Learn more

Learn more

Learn more

Learn more

Learn more

Learn more

Learn more

Learn more

Learn more

Learn more

Learn more

Learn more

Learn more

Learn more

Learn more

Learn more

Learn more
Custom Reports, Charts, and Dashboards
Create custom reports, charts, and dashboards with an easy-to-use drag-and-drop report builder. Create new tables, charts, reports, and dashboards with just a couple of clicks. Quickly discover new insights and opportunities with all your data at your fingertips.
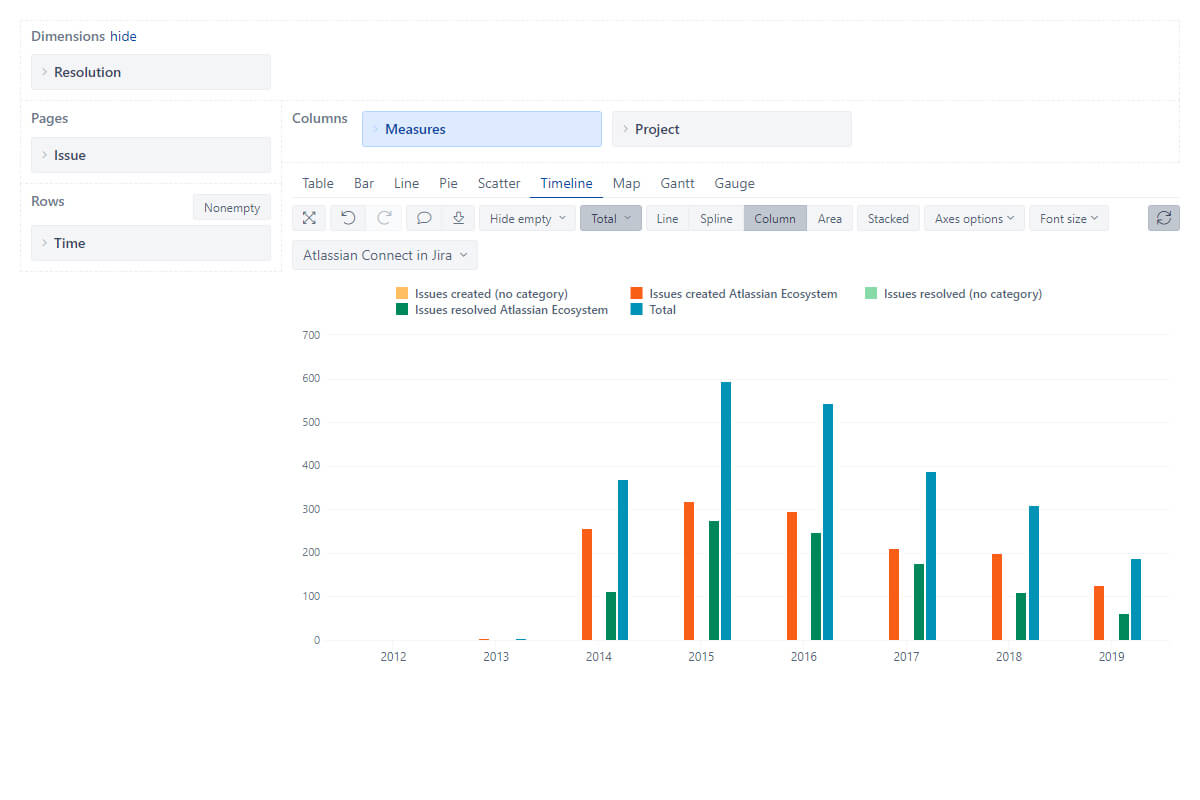
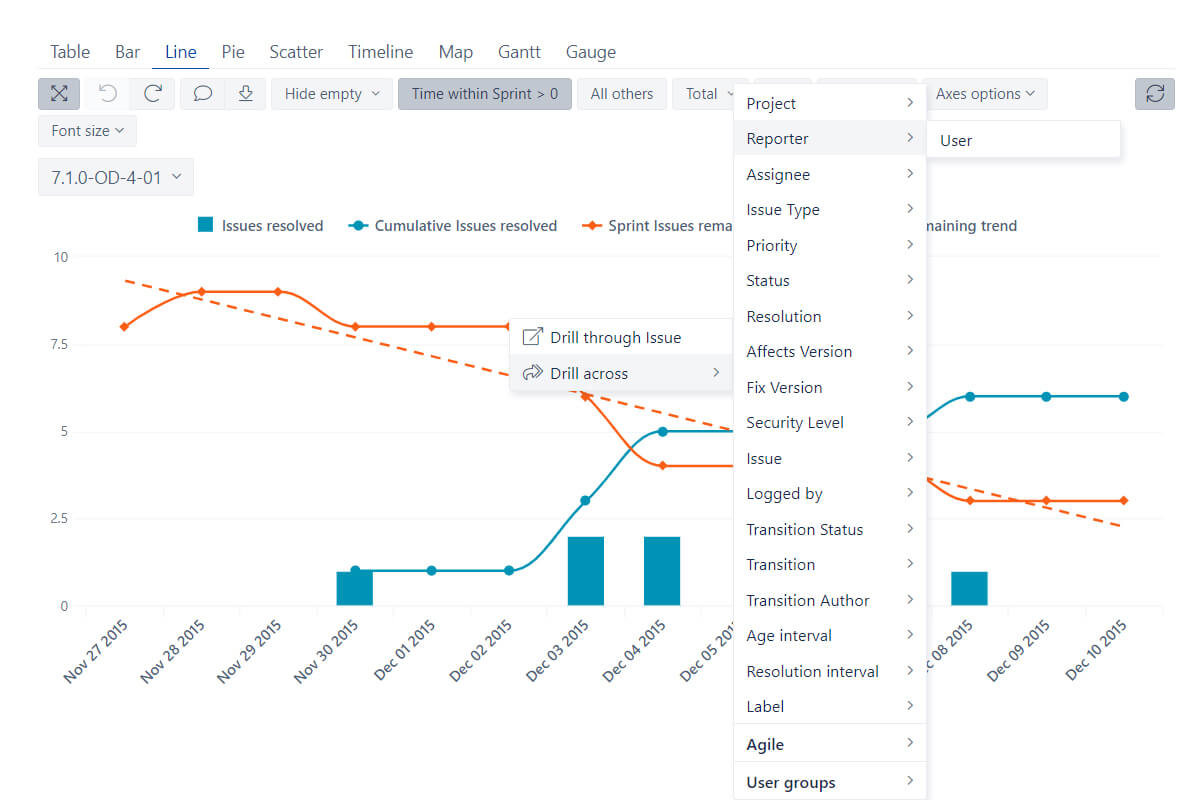
Interactive Data Analysis and Visualization
Explore and analyze your data with an instant feedback. Start with a summary and dig into details to examine your business data with multi-dimensional analysis. Drill-in or across other dimensions right from the report. Find actionable insights, trends, and opportunities, make smart and data-driven decisions.
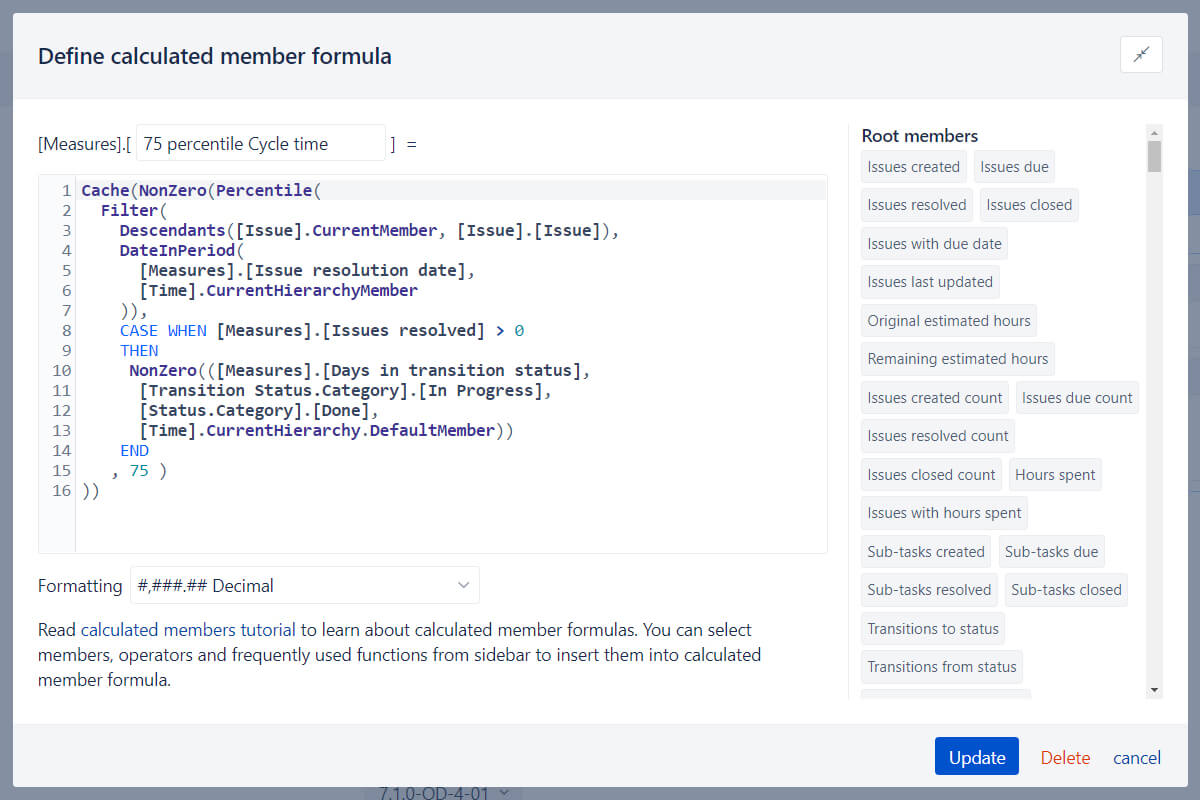
Powerful Calculations for Advanced Users
Go way beyond basic analysis by creating new measures and powerful calculations. Start with many predefined calculations or write your own using the built-in MDX editor with auto-complete and syntax highlighting. Perform multi-dimensional analysis and examine your business data in almost any way you need.
12000+ Installs, 5000+ Customers from 150+ Countries
Thousands of customers from all around the world use eazyBI for reporting to make better decisions at all levels of management.


Support & Resources
eazyBI’s powerful report builder comes with an extensive knowledge base, a vibrant community, and experienced support.


An excellent tool with an excellent support team!! The best thing about this tool is its flexibility to support varied features.
We are moving all our reports to eazyBI and also creating new reports which help us work much faster.
Completely worth the price!!
Very useful tool and really great support. Thank you. We had to import external data and map some tricky data. Support helped us with the mapping, measures, and concepts. Really cool, thanx a lot!
Excellent BI tool, LEGENDARY SUPPORT (never had such detailed and competent responses from any support team!), extremely customizable, clean interface design... Give it a try, then stick to it for any report you need.
Purchased eazyBI after a significant investigation to replacing our complex in-house built reports. In contrast to most of the other solutions, it is very mature in its configuration and features the power and flexibility required for my super users.
We are an Internet agency and using Harvest for time tracking and invoice generation. But it turned out that the built-in reports from Harvest are not able to provide real management insights. Exporting data to third party apps and generating statistics by hand is time consuming and not flexible enough. With eazyBI we have found the solution that enables us to connect Harvest with a business intelligence tool that everyone can use. Within a very short time we have created management dashboards that provide us important insights on profitability, liquidity and much more. I highly recommend eazyBI for every Harvest user!
Utilizing eazyBI for our weekly Zendesk status meetings provides us exactly what we need when it comes to observing month-to-month activity between our team and what we can predict for activity in the future. The graphical reporting function eazyBI contains is easy to use and understand thanks to the lucid documentation that is provided. You can pretty much report on any data that Zendesk provides, creating reports that offer crucial information such as Comparison between Open and Solved Tickets per month and Total Resolution Time over the span of a year! It’s a very cost-effective tool and, if specifically used with Zendesk, you’ll get the integration you’re looking for.
eazyBI Cloud Pricing & Plans
Creators
($20 per user)
(€18 per user)
Admins, data importers, report and dashboard creators
Viewers
($5 per user)
(€4.5 per user)
Only report and dashboard viewers
- 200MB storage (per creator)
- Automatic data import at a specified time every day. On-request manual data import available any time.
- Import data from supported data sources and applications.
- Export your charts as PDF or PNG files and chart data as XLSX or CSV files.
- Embed and share your reports using <iframe>.
Starting from 5 creators or 20 viewers
- Embed and share your reports to non-eazyBI users using public access tokens.
- Receive regular dashboard snapshots as PDF attachments in your email.
- Create data access roles to limit user access to report folders, dashboards, or data cubes.
Start a 30-day Free Trial
Try eazyBI free for 30 days to see if it's right for you. If you need any help or support, feel free to reach out to support@eazybi.com—we're there for you.
We also offer a free PUBLIC plan for publishing public data to everyone.
4 Data sources
100MB Storage
Export results
Custom fields import
Embed reports
Contact us for more information


Frequently Asked Questions
What is eazyBI Cloud?
eazyBI Cloud is the standalone, web-based SaaS version of eazyBI — no servers, no setup, no hassle. You work entirely in the browser to build reports, charts, and dashboards.
It uses the same core analytics engine across platforms (multidimensional model, interactive reports, and optional MDX for advanced calculations).
Is there a free trial?
Yes. The eazyBI Cloud trial is 30 days, no credit card required, and risk-free.
You can start here: Sign up
How does billing work (monthly vs annual)?
eazyBI Cloud offers monthly and annual billing. Annual plans include 2 months free compared to paying monthly.
The Service is billed in advance and is non-refundable. There are no refunds or credits for partial months of service, upgrade/downgrade refunds, or refunds for unused months.
When upgrading, any unspent paid amount is applied as a pro-rated discount to the new plan. Downgrades are not refunded; you can keep using the paid service and the downgrade takes effect in the next billing cycle.
See details on the Pricing page.
Where is eazyBI Cloud hosted, and where can I find security details?
eazyBI Cloud is hosted on Google Cloud in Europe (EU) (europe-west1 data center in Belgium).
For security details, see: Security
What data sources can I connect to?
eazyBI Cloud can import data from many sources, including:
- Web applications via REST APIs
- Databases via SQL queries
- Files like CSV and Excel
You can combine multiple sources for cross-domain reporting.
How do sharing and embeds work?
eazyBI supports public accounts (data visible to external users) and closed accounts.
For closed accounts, you can enable publishing to create public embeds/iframes using a public-access token. Closed-account reports can be embedded anywhere, but remain accessible only to authenticated eazyBI account users unless published.
Email subscriptions generate PDF snapshots (not interactive).