



Reports and dashboards from your own data
Upload CSV and Excel files, connect Google Sheets, or import from a REST API, and create interactive charts, reports, and dashboards with drag and drop.
Three ways to bring in your data
Upload CSV and Excel files
eazyBI recognizes the field separators, number formats, headers, and dates. When you upload a new file, eazyBI reuses the mapping of the previous one.
Connect Google Sheets
Select a Google Sheets file, or a Microsoft 365 Excel file in OneDrive or SharePoint, and schedule a daily import of its data.
Import from a REST API
Import JSON, XML, or CSV data without exporting it first. Transform it with JSONPath, XPath, or custom JavaScript, and refresh it every day.
Demo dashboards & template library
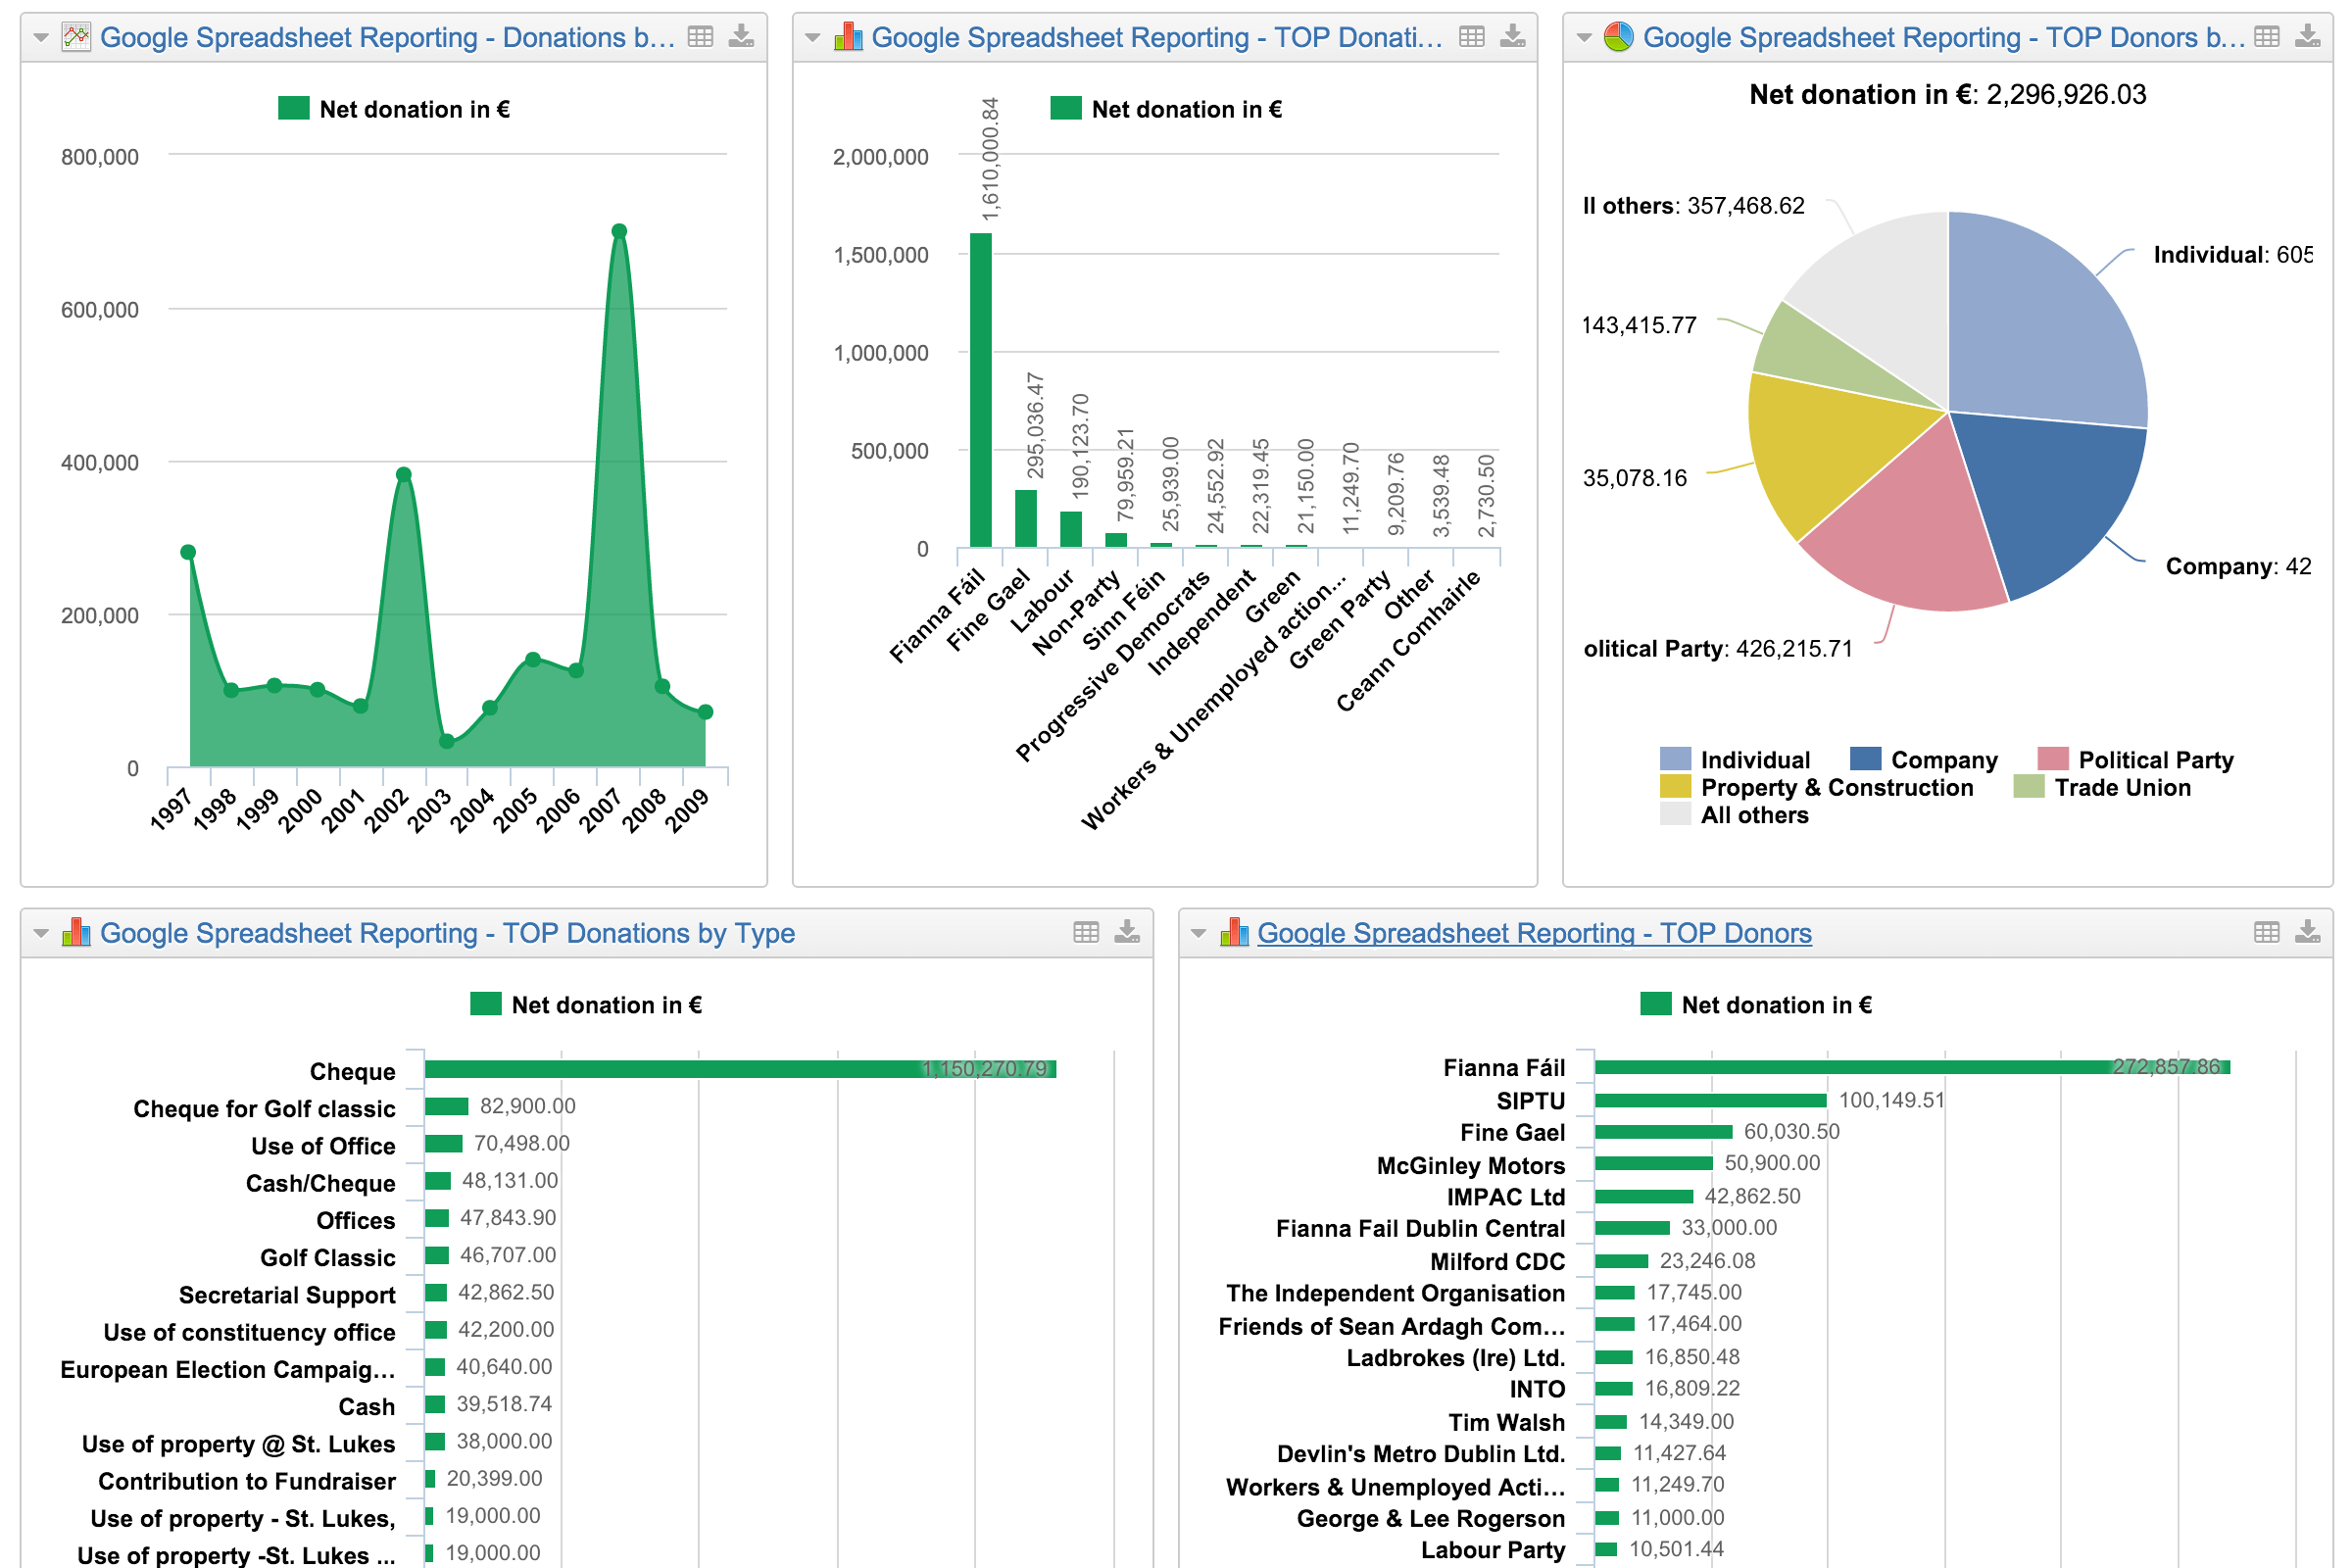
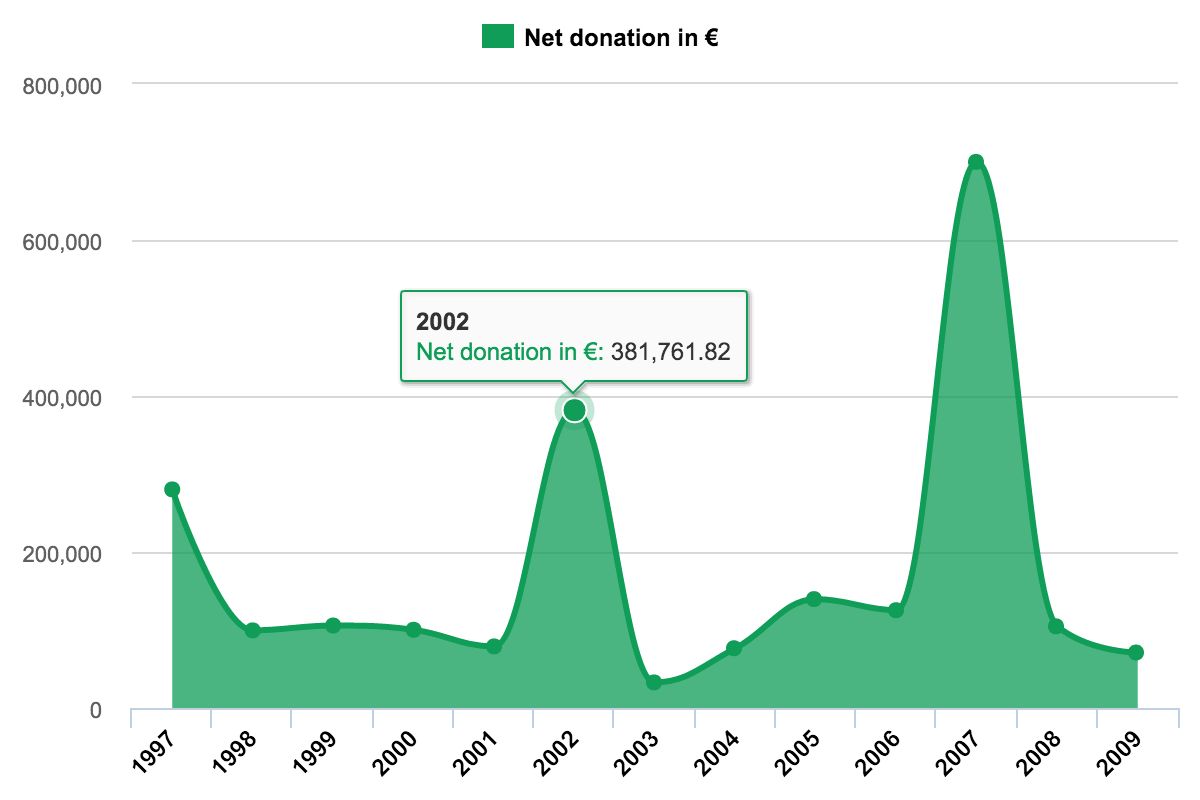
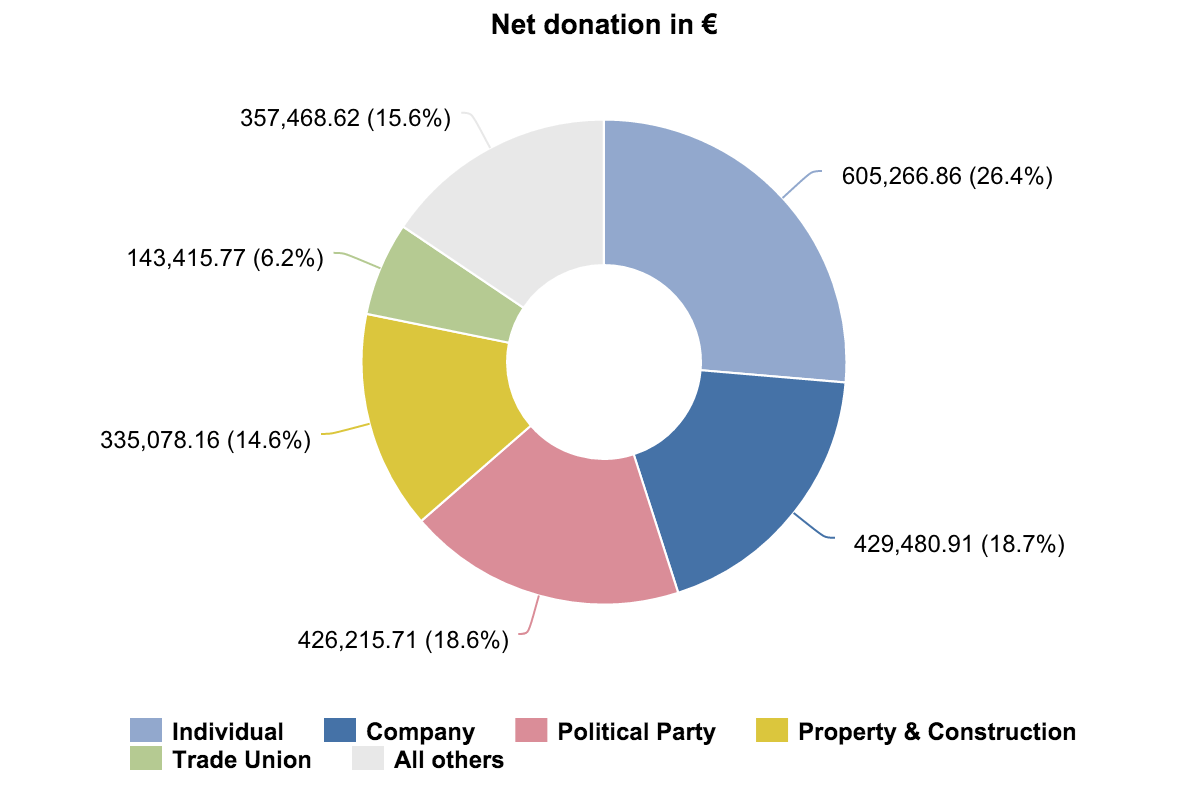
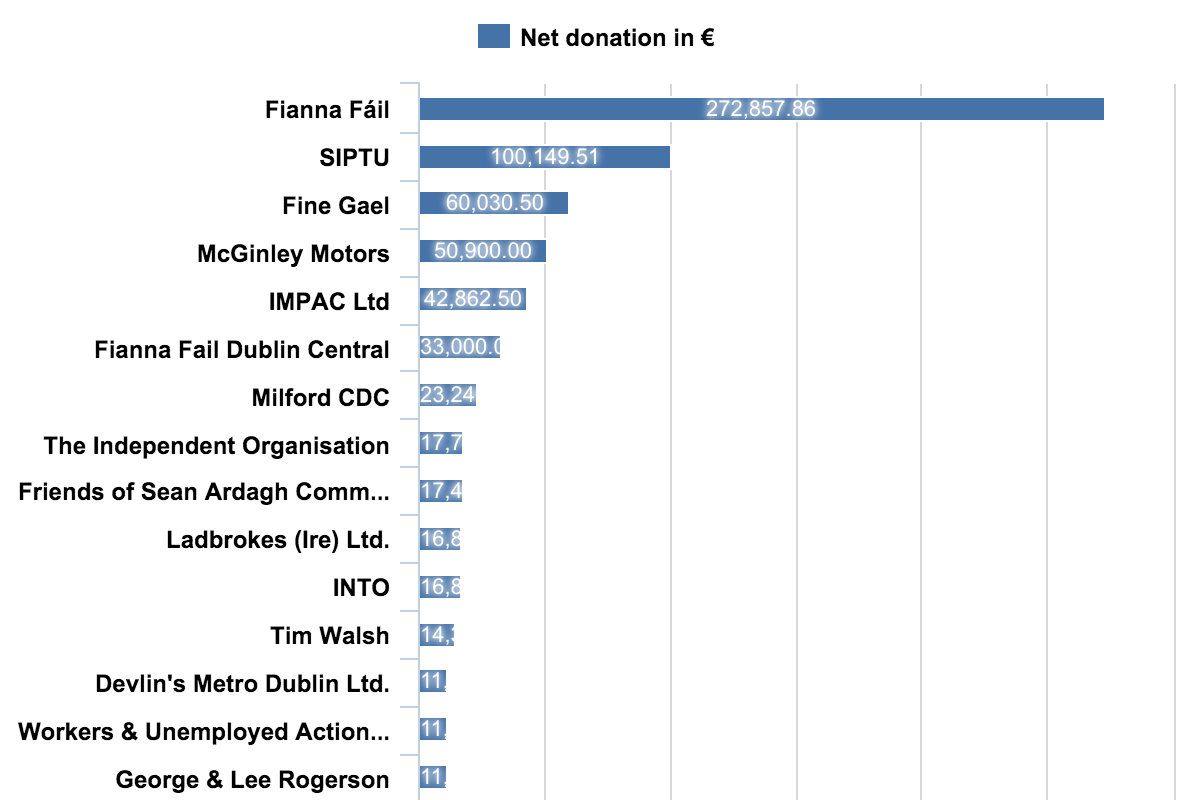
Explore the CSV, Excel, and Google Sheets reports of the demo account, and import the ones you like to your account as templates.
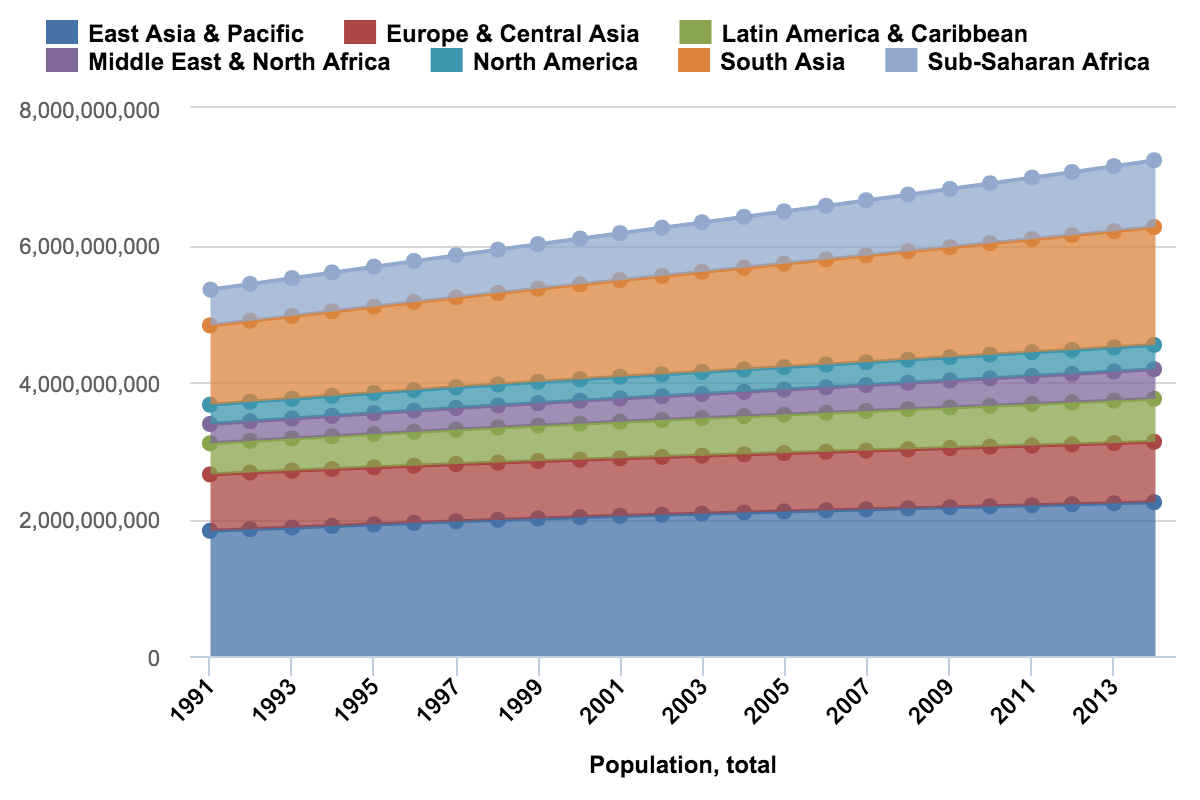
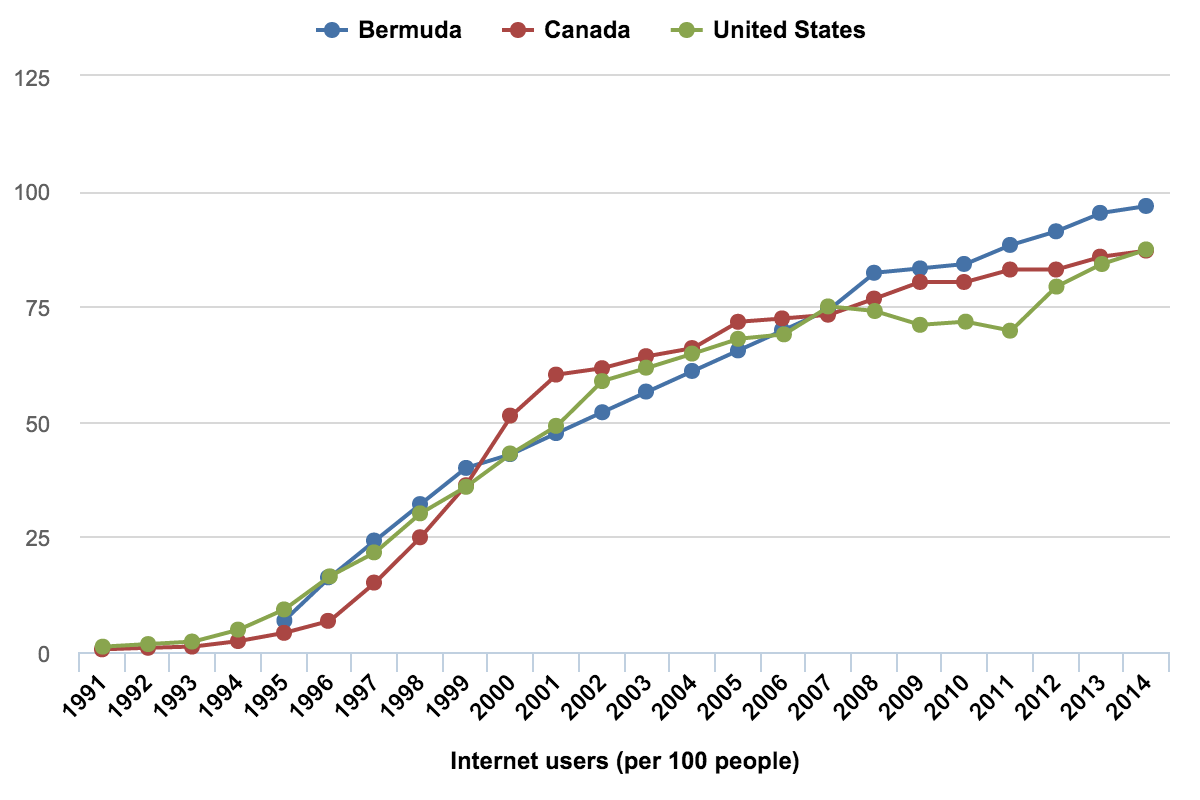
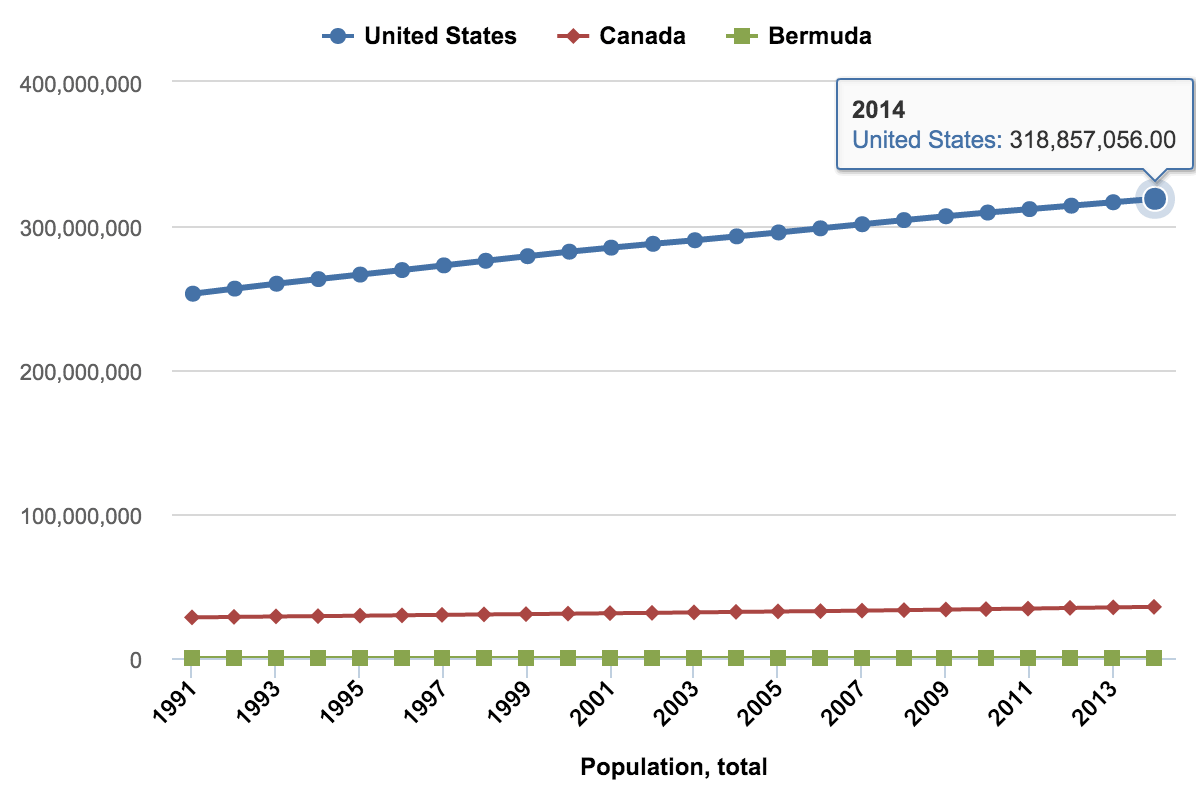
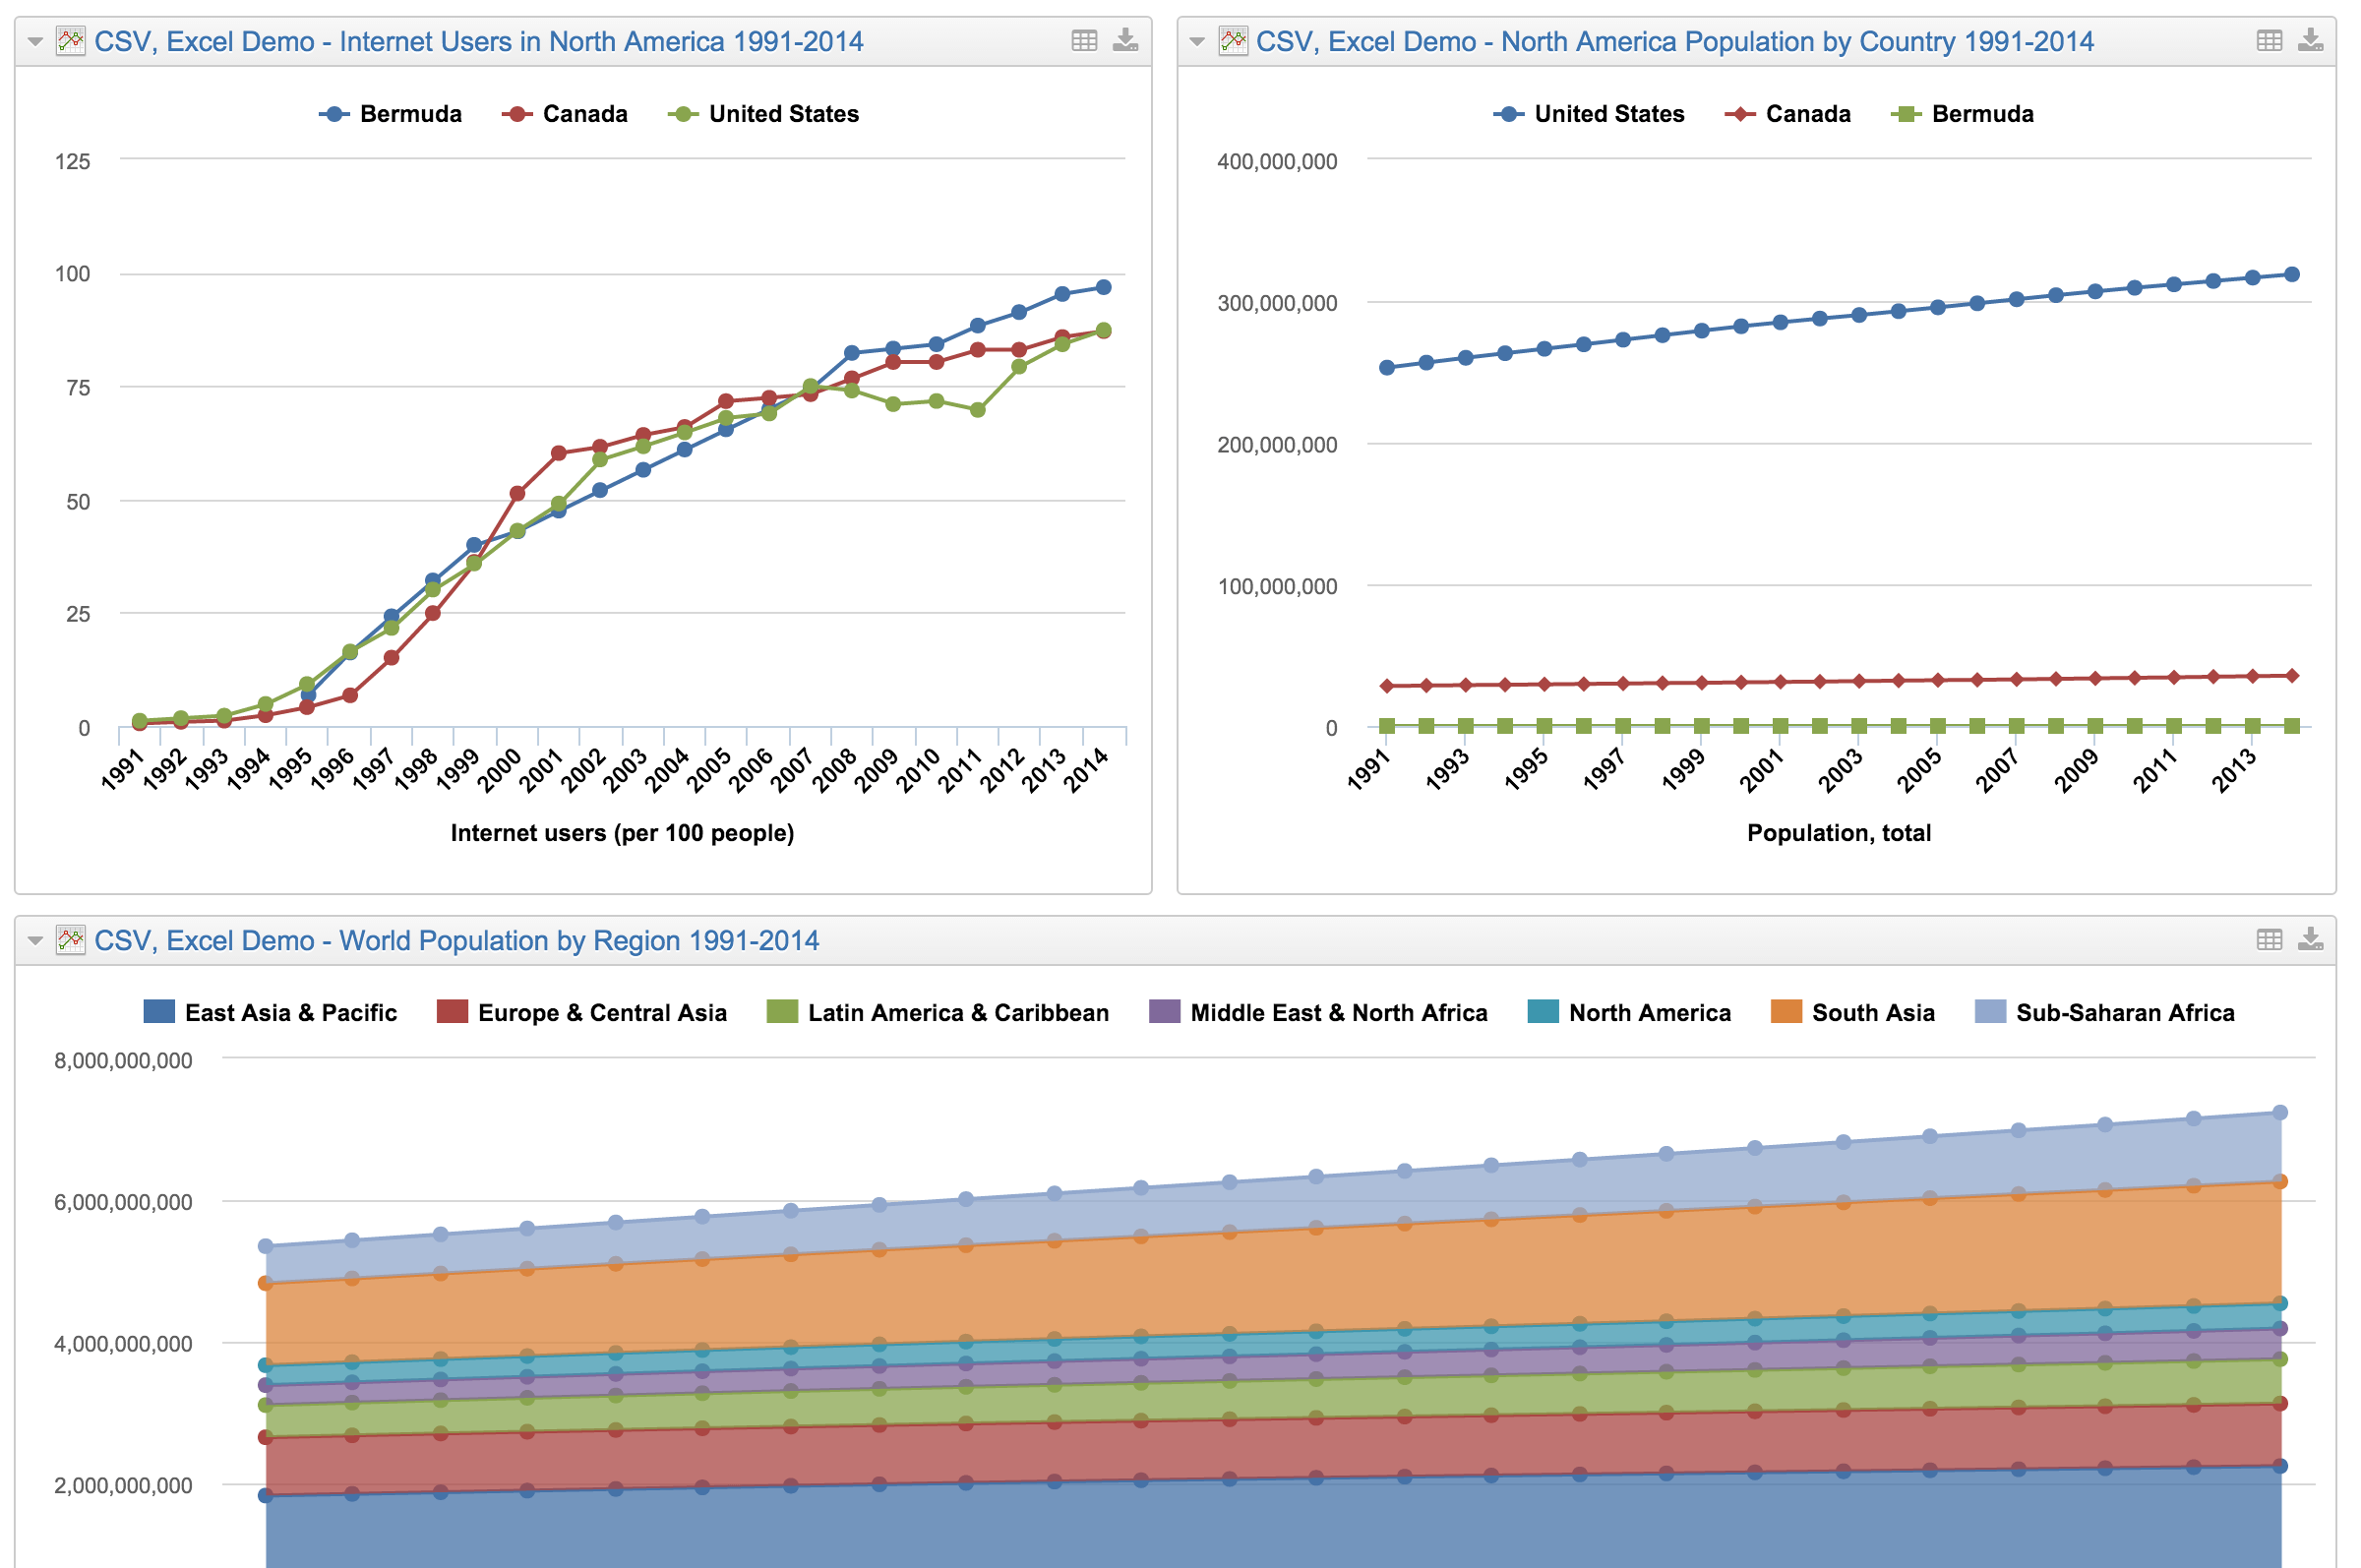
The internet users and population of North America and the world population by region, from the World Development Indicators, on one dashboard.
eazyBI Cloud pricing & plans
- 200MB storage (per creator)
- Automatic data import at a specified time every day. On-request manual data import available any time.
- Import data from supported data sources and applications.
- Export your charts as PDF or PNG files and chart data as XLSX or CSV files.
- Embed and share your reports using <iframe>.
Starting from 5 creators or 20 viewers
- Embed and share your reports to non-eazyBI users using public access tokens.
- Receive regular dashboard snapshots as PDF attachments in your email.
- Create data access roles to limit user access to report folders, dashboards, or data cubes.
Support & resources
eazyBI’s powerful report builder comes with an extensive knowledge base, a vibrant community, and experienced support.
 Support
Top-rated support ready to guide you through your reporting journey.
 Documentation
Detailed documentation with tutorials, instructions, use cases, and how-to videos.
 Community
Active and growing user community with shared experiences and practical solutions.
 Learning Center
Hands-on, self-service lessons to build different reports and grasp BI concepts.
12000+ installs, 5000+ customers from 150+ countries


Put your data to work
Find the eazyBI that fits your work. Start with a free eazyBI trial.


