Custom Zendesk Reports and Dashboards Made Easy
Extend standard Zendesk reports with a flexible and easy-to-use ticket and forum visualization, analysis, and reporting tool.
How It Works
A Complete Overview of Your Zendesk Tickets
Zendesk help desk is one of the most popular web-based customer service and support ticket tools used by tens of thousands of organizations worldwide.
Unfortunately, the built-in Zendesk reporting system leaves much to be desired.
eazyBI greatly extends standard Zendesk reports with an advanced, easy-to-use, flexible visualization, analysis, and reporting system.
Here’s what you can do:
- Import all your Zendesk data into eazyBI with just a couple of clicks and enjoy automatic data updates.
- Easily create tables, charts, and reports with drag-and-drop simplicity.
- Use pre-defined sample reports and dashboards or create your own.
- Have an overview of your Zendesk tickets—created, solved, open, and due—and never miss a sight of your activities.
- Analyze wait time, resolution time, and on-hold time information.
- Keep an eye on good and bad satisfaction ratings, and a “good satisfaction ratio.”
- View your reports by status, ticket type, priority, requester, assignee or any time dimension— any way you like.
Zendesk Report and Dashboard Examples
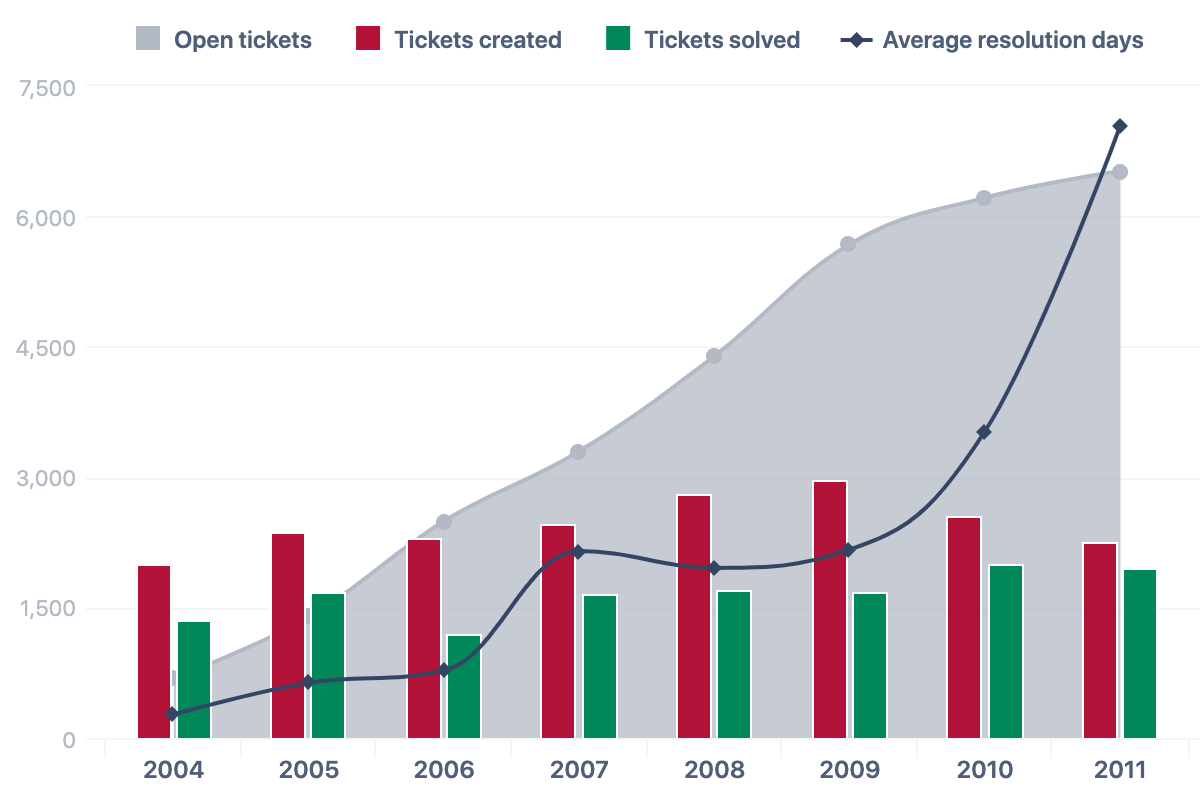
Zendesk Reports – Issue Stats Overview
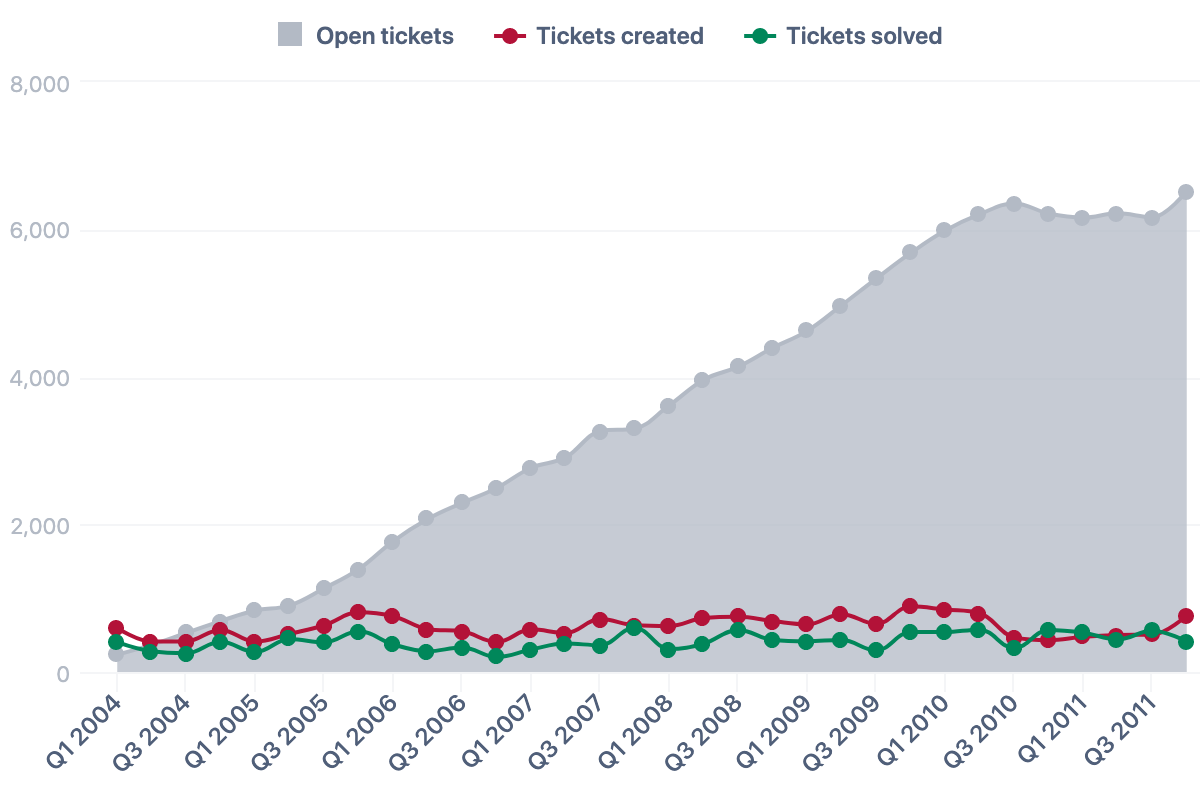
Zendesk Reports – Quarterly Created vs Solved Tickets
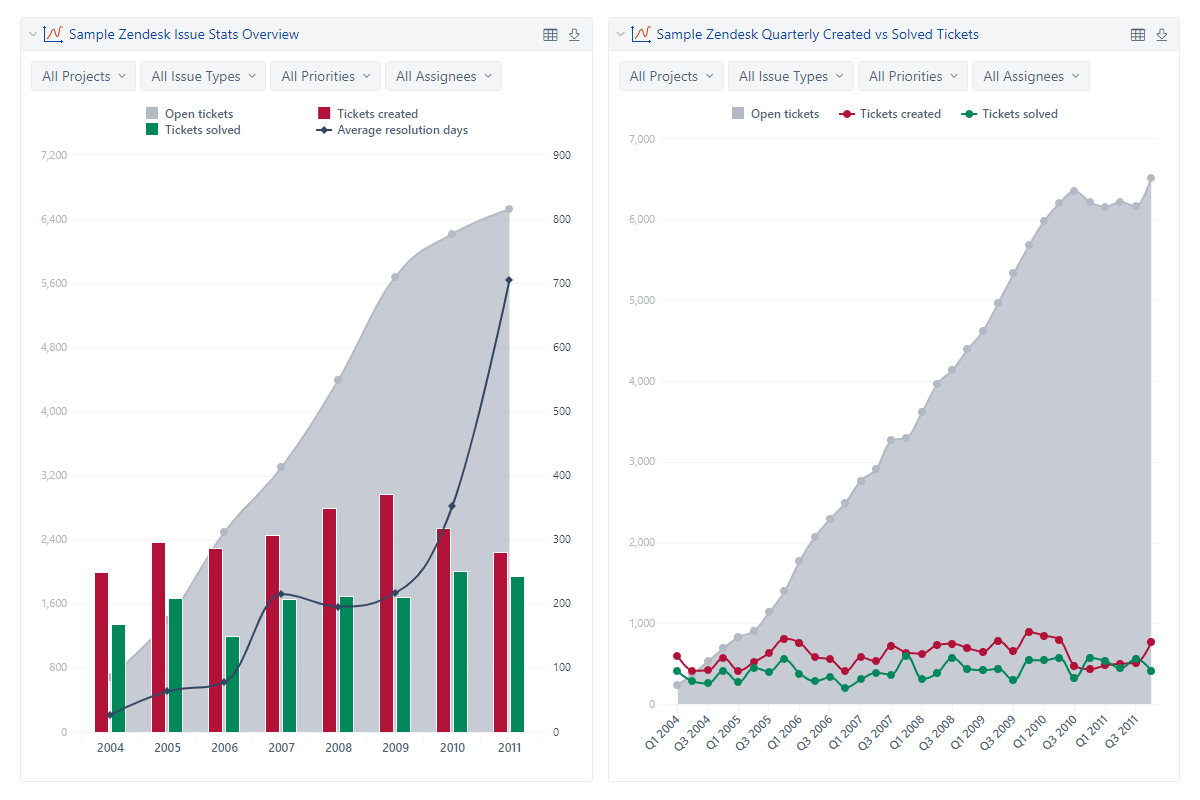
Zendesk Issue Report Dashboard
Utilizing eazyBI for our weekly Zendesk status meetings provides us exactly what we need when it comes to observing month-to-month activity between our team and what we can predict for activity in the future. The graphical reporting function eazyBI contains is easy to use and understand thanks to the lucid documentation that is provided. You can pretty much report on any data that Zendesk provides, creating reports that offer crucial information such as Comparison between Open and Solved Tickets per month and Total Resolution Time over the span of a year! It’s a very cost-effective tool and, if specifically used with Zendesk, you’ll get the integration you’re looking for.
Start a 30-day Free Trial
Try eazyBI free for 30 days to see if it's right for you. If you need any help or support, feel free to reach out to support@eazybi.com—we're there for you.


Questions, Feedback, Support, and Documentation
Please feel free to contact eazyBI support if you have any questions, feedback, or suggestions. We are always happy to hear from our clients.
For more detailed information about eazyBI for Zendesk — concepts, data import, creation of charts, reports, and dashboards — please refer to eazyBI Zendesk documentation.
