
Analyze Jira Apps with eazyBI
Atlassian is a rich ecosystem with native and 3rd party apps covering almost every aspect of DevOps lifecycle, from project and time management to test and asset management and beyond. Analyze and visualize Jira and many popular Jira apps–all in one place with eazyBI. Find out how to extend your Jira reporting perspective with eazyBI.
Custom Jira Reporting with eazyBI–how it works?
eazyBI is a general-purpose data visualization and analysis tool with a native Jira integration. Because of that, it is flexible and customizable. You can create a set of cross-project Jira custom reports and dashboards with actionable KPIs and project status reports showing exactly who is working on what, when, where, and why.
eazyBI provides a complete Jira data model out-of-box. Start creating your Jira reports and dashboards in a few clicks. Despite a very complex Jira structure with many workflows, projects, epics, stories, subtasks, and custom fields, the eazyBI’s Jira data model enables instant access to all your Jira data and more.
eazyBI is built for speed and performance, providing quick and effective data updates, reduced impact on Jira performance, and real-time data exploration with instant feedback.
Data Import From Other Sources
With eazyBI for Jira, you can analyze data from standard or custom fields from Jira Software, Jira Service Management, Bitbucket, Bamboo, Insight, and many Jira apps - Tempo Timesheets, Tempo Planner, Zephyr Scale, Zephyr Squad, Xray, Deiser Projectrak, Scriptrunner, Elements Connect.
Import data from external data sources like SQL databases, Rest API, Google Sheets, CSV, or Excel spreadsheets and include them in your Jira reports. eazyBI also supports data import from popular web applications like Highrise, Harvest, Zendesk, Git, Freshbooks, etc.
Tempo Timesheets
Tempo Timesheets is a #1 time tracking and reporting solution in the Atlassian ecosystem integrating with Jira to help software, IT, service desk, and business teams and managers track time for accounting, payroll, client billing, and enhanced efficiency, and forecasting.
Use eazyBI to complement your Jira reports with Tempo billed hours or hours spent by Team, Account, Tempo Category, Tempo Customer, Logged by Team, or Tempo worklog attributes. Combine hours spent with the budget, add cumulative hours spent and see if you are on track with the budget allocation. Find out how many hours are logged by the team and individual team members.
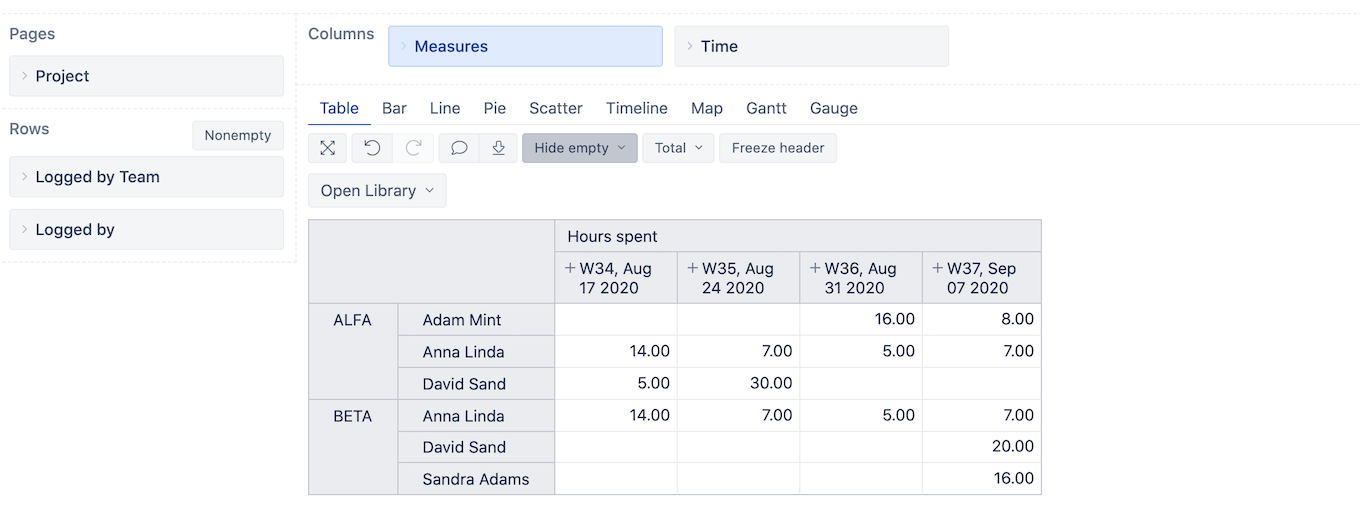
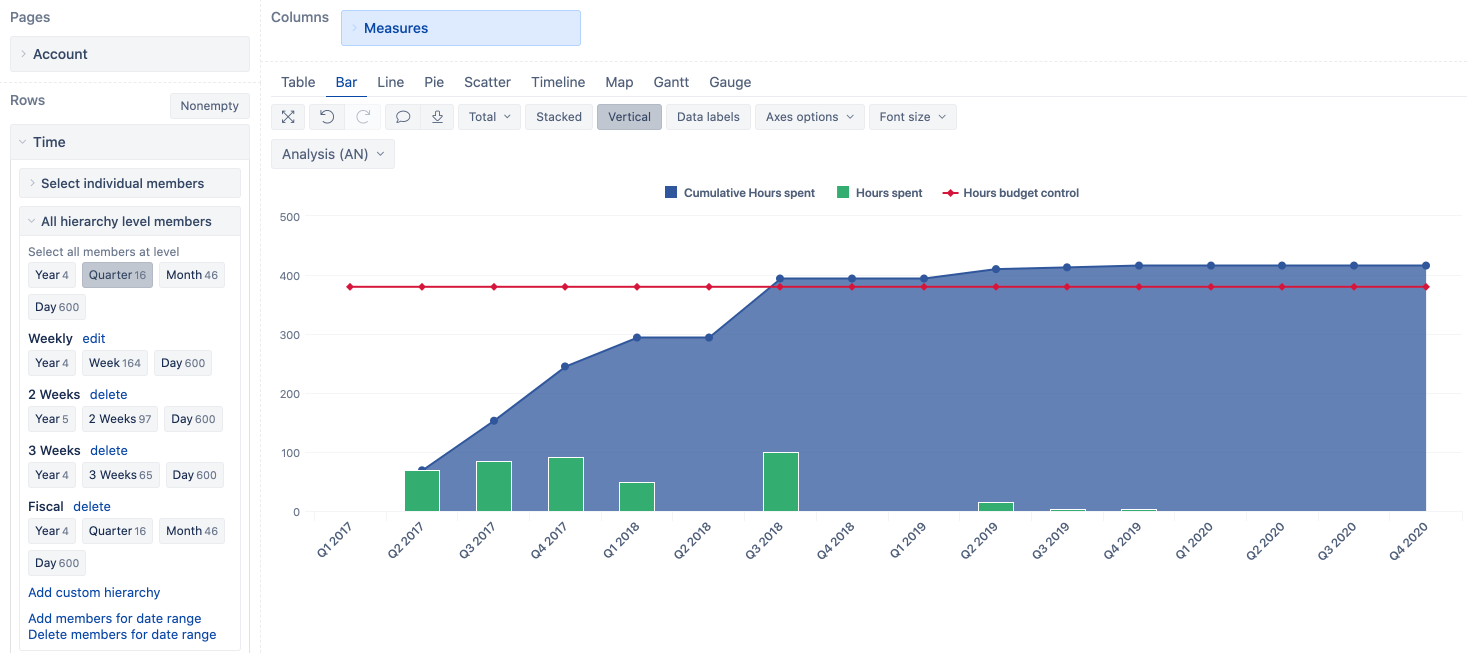
Find more information about the Tempo Timesheets reporting with eazyBI in our documentation.
Tempo Planner
Tempo Planner is the most effective and dynamic resource planning and capacity reporting tool embedded in Jira. Manage resources and capacity in Jira and provide a real-time view of all resources and their status and plans.
With eazyBI, you can track your project progress with Tempo Planner custom reports to ensure your projects are on time and budget. Analyze hours spent by the team and by the assignee over a period of time. See how much time was logged by each of the teams or in total. Balance your teams and employees to complete your projects on time and within budget.
Use the cumulative Tempo planned hours as a guideline and project roadmap. Add weekly hours spent and cumulative hours spent to see how you stack against the plan. Are you on track? Have you over or underestimated?
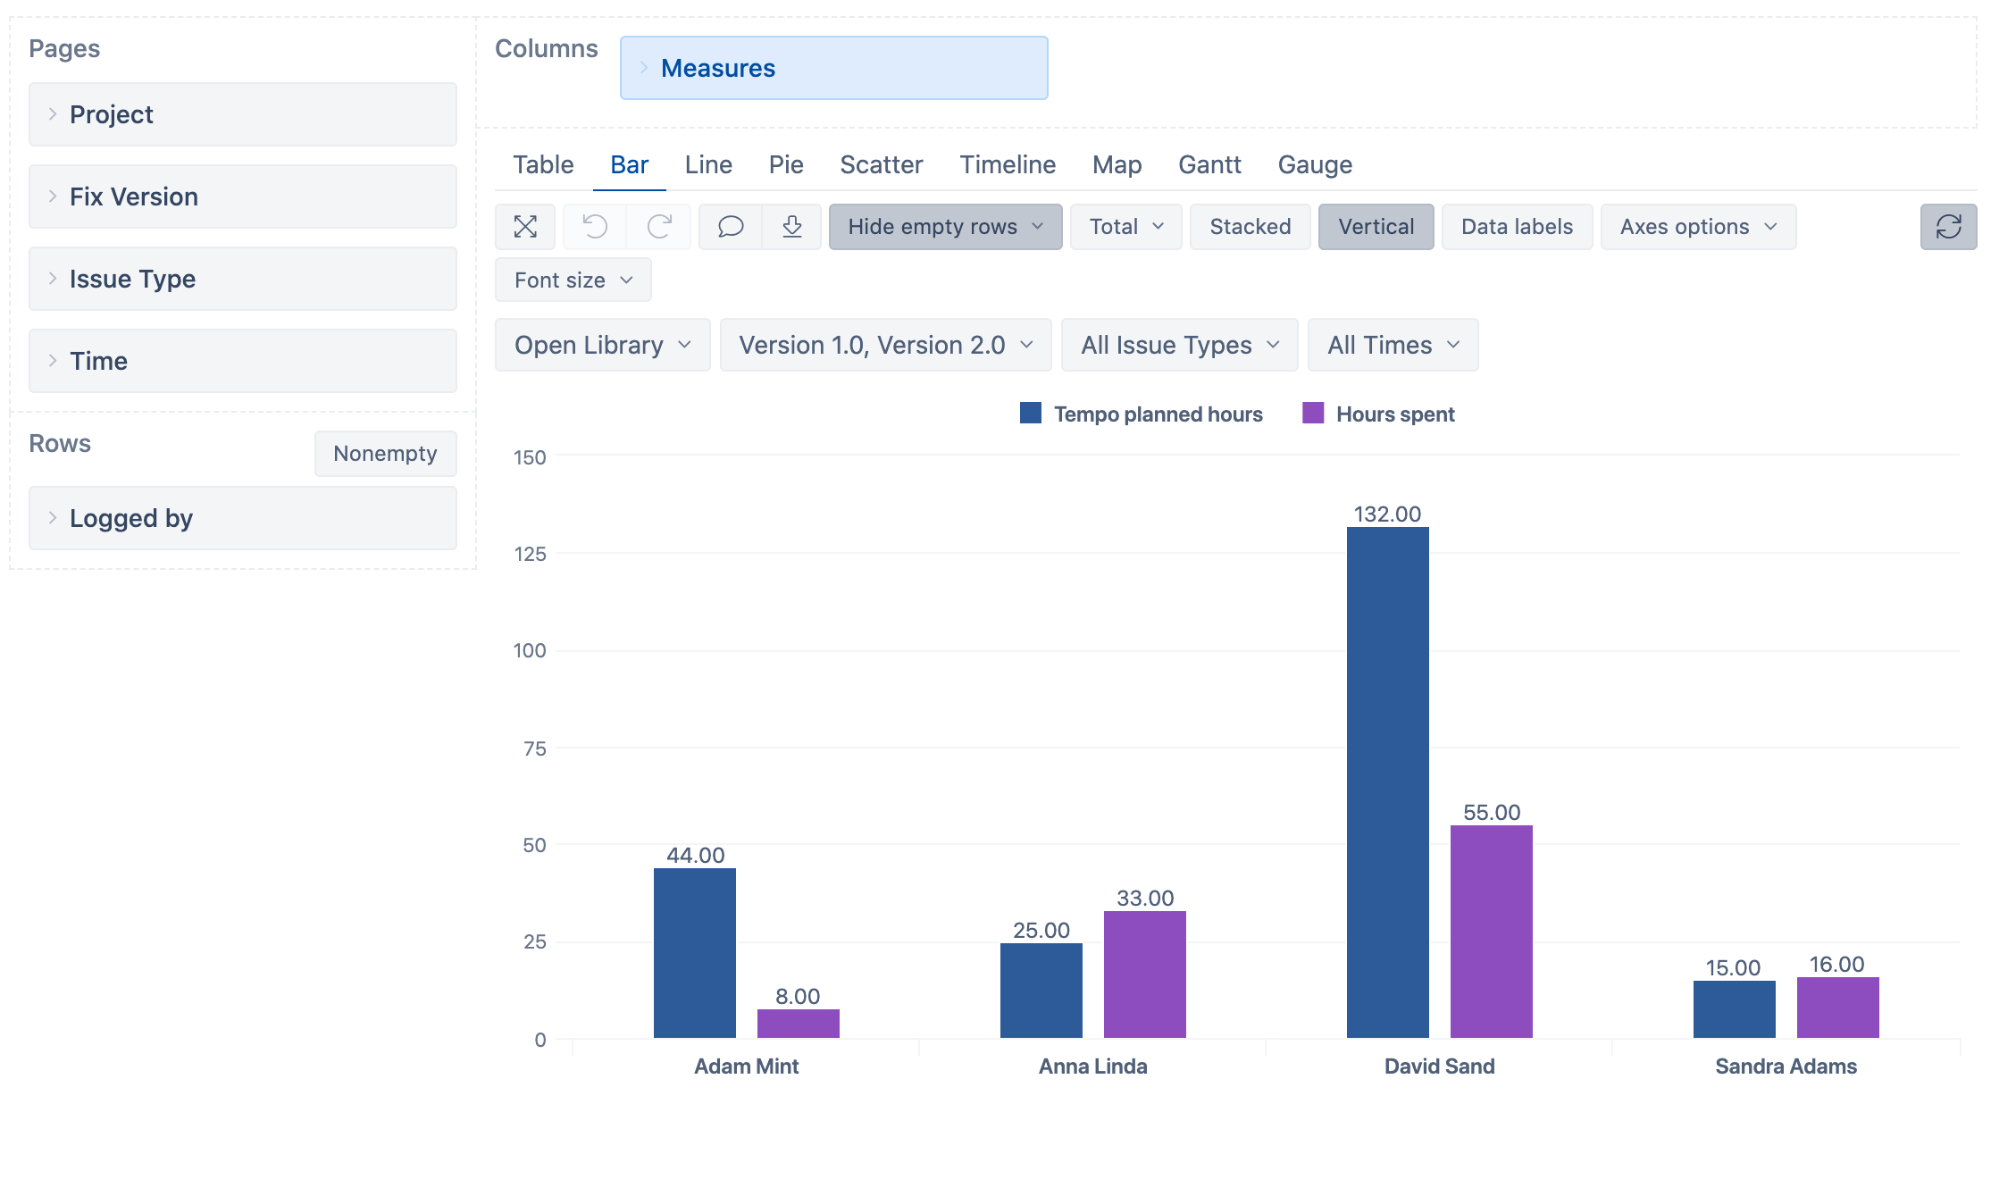
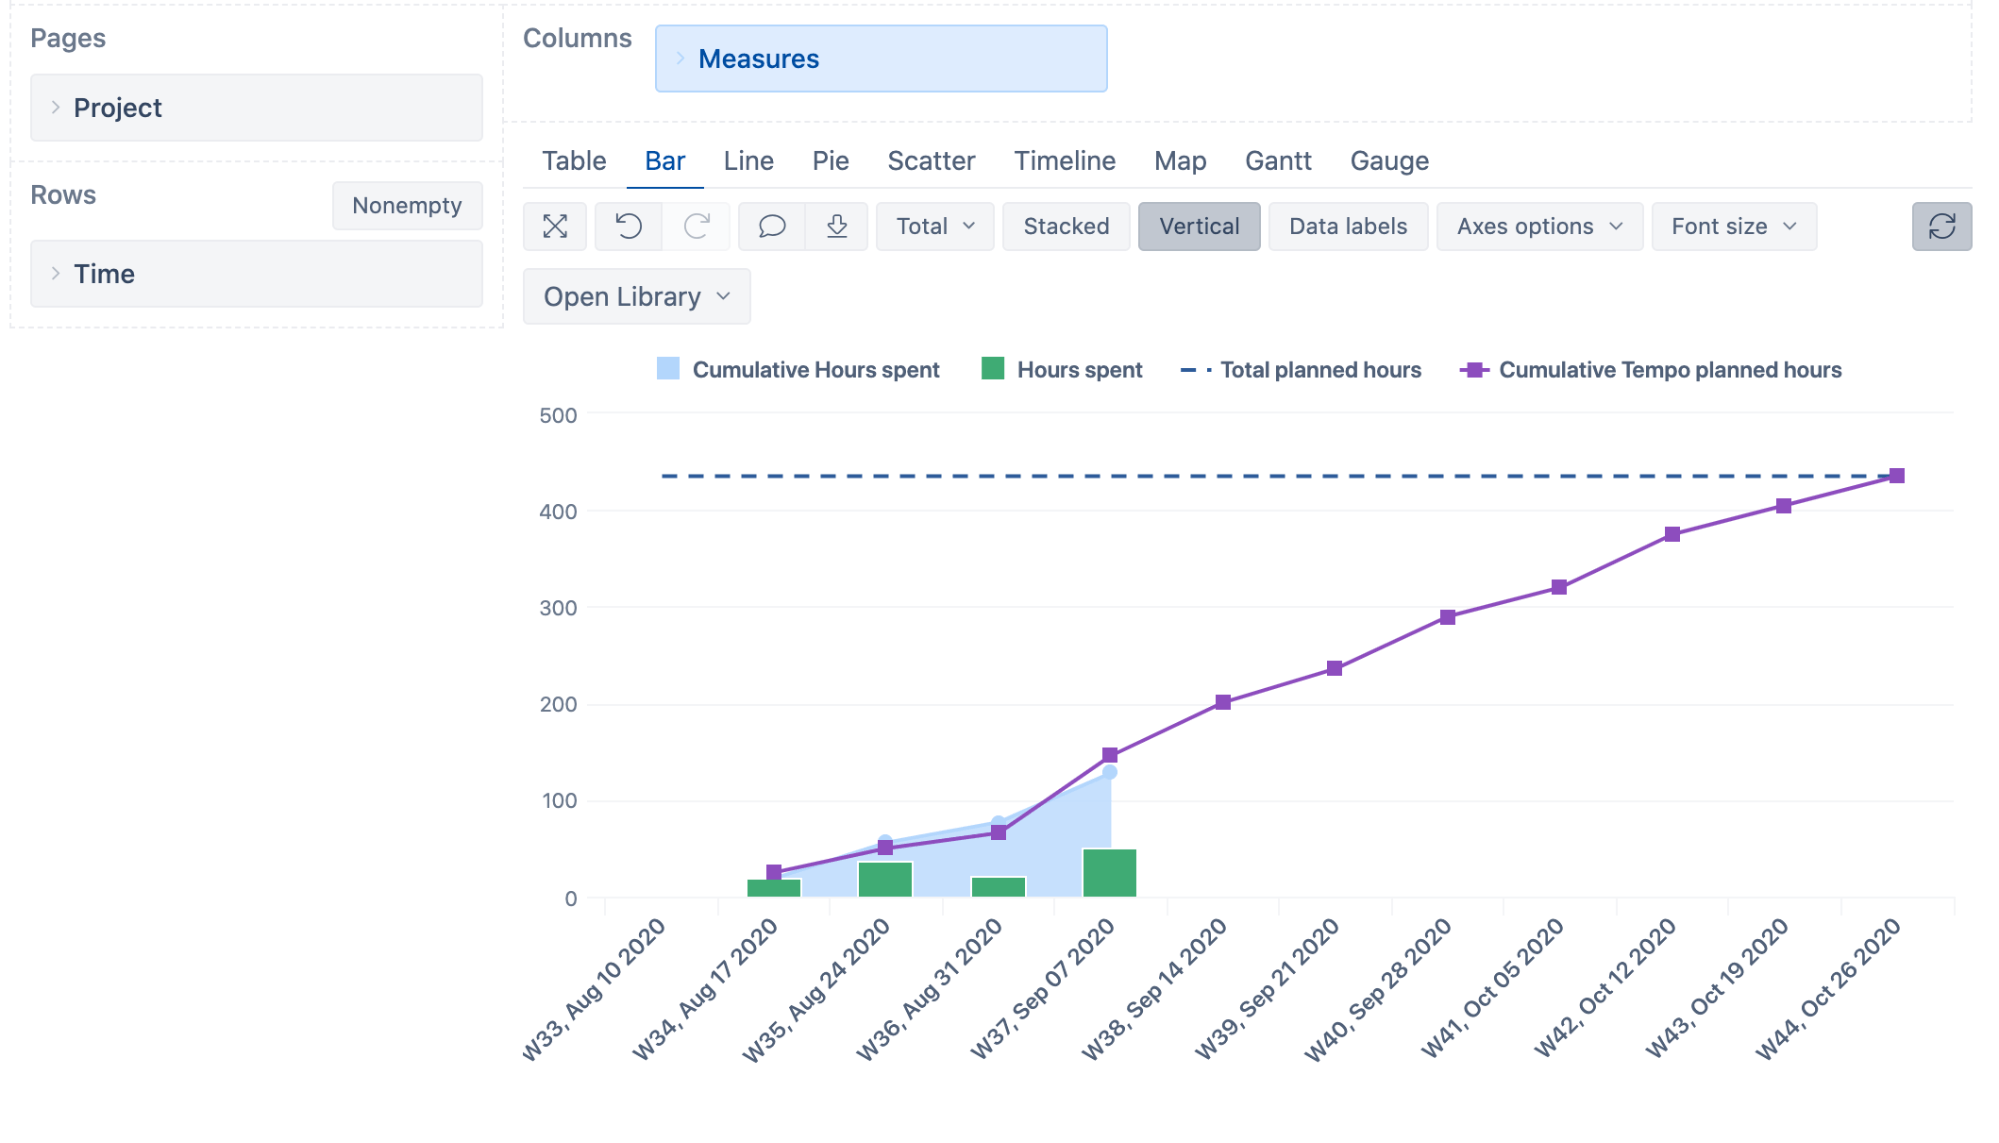
Watch more Tempo Planner reporting use cases with eazyBI or find out a full list of Tempo Planner attributes available for import in eazyBI in the documentation.
Insight Asset Management
Boost your productivity in Jira with powerful Asset Management & IT Service Management app. Insight provides a structured view of your assets to link to Jira issues with custom fields, providing deeper insight into your most important assets and the dependencies between them, including hardware, software, people, facilities, licenses, and much more.
Enhance your Jira Insight reporting with eazyBI–measure Insight objects created, changed, including change history, transition statuses, and transition times. Then, add an extra "layer" of data in your Jira reports by adding Insight custom fields, Insight objects, object attributes, relationships, and more.
Insight custom fields will allow you to extend standard Jira reporting capabilities. For example, find out how many issues are reported for a particular asset or which asset model has the largest number of issues created. Details on assets provide insight on how to plan resources and support for specific asset types.
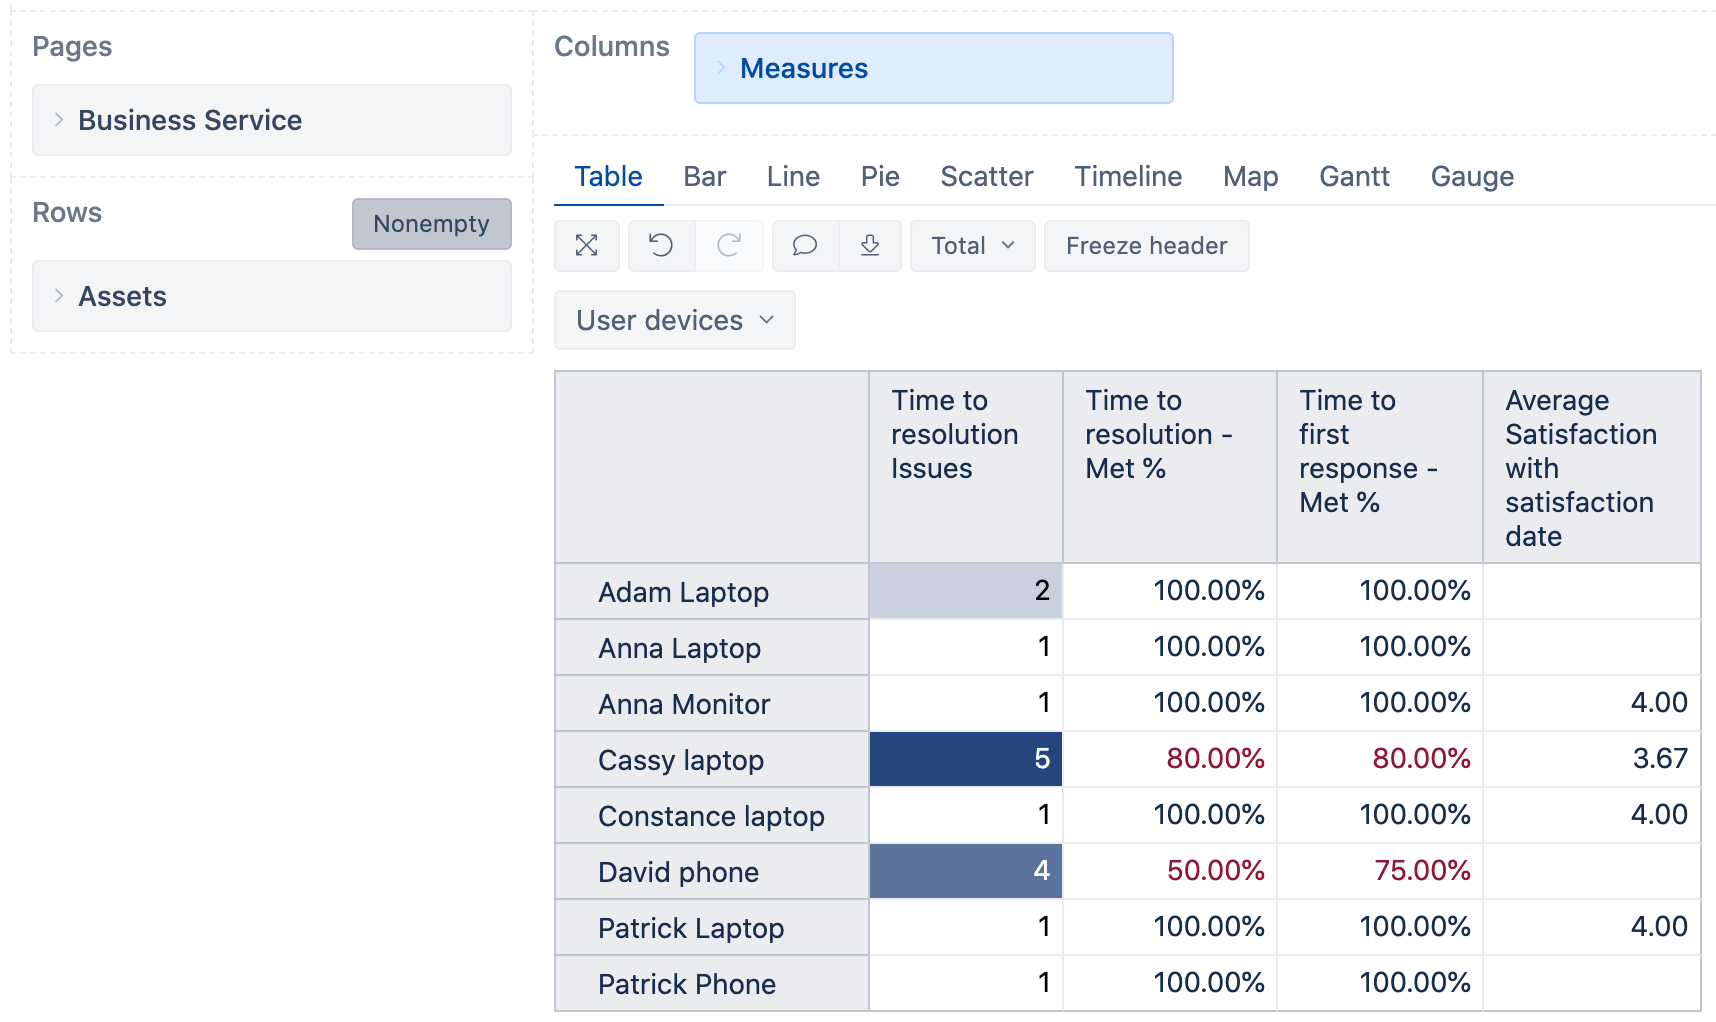
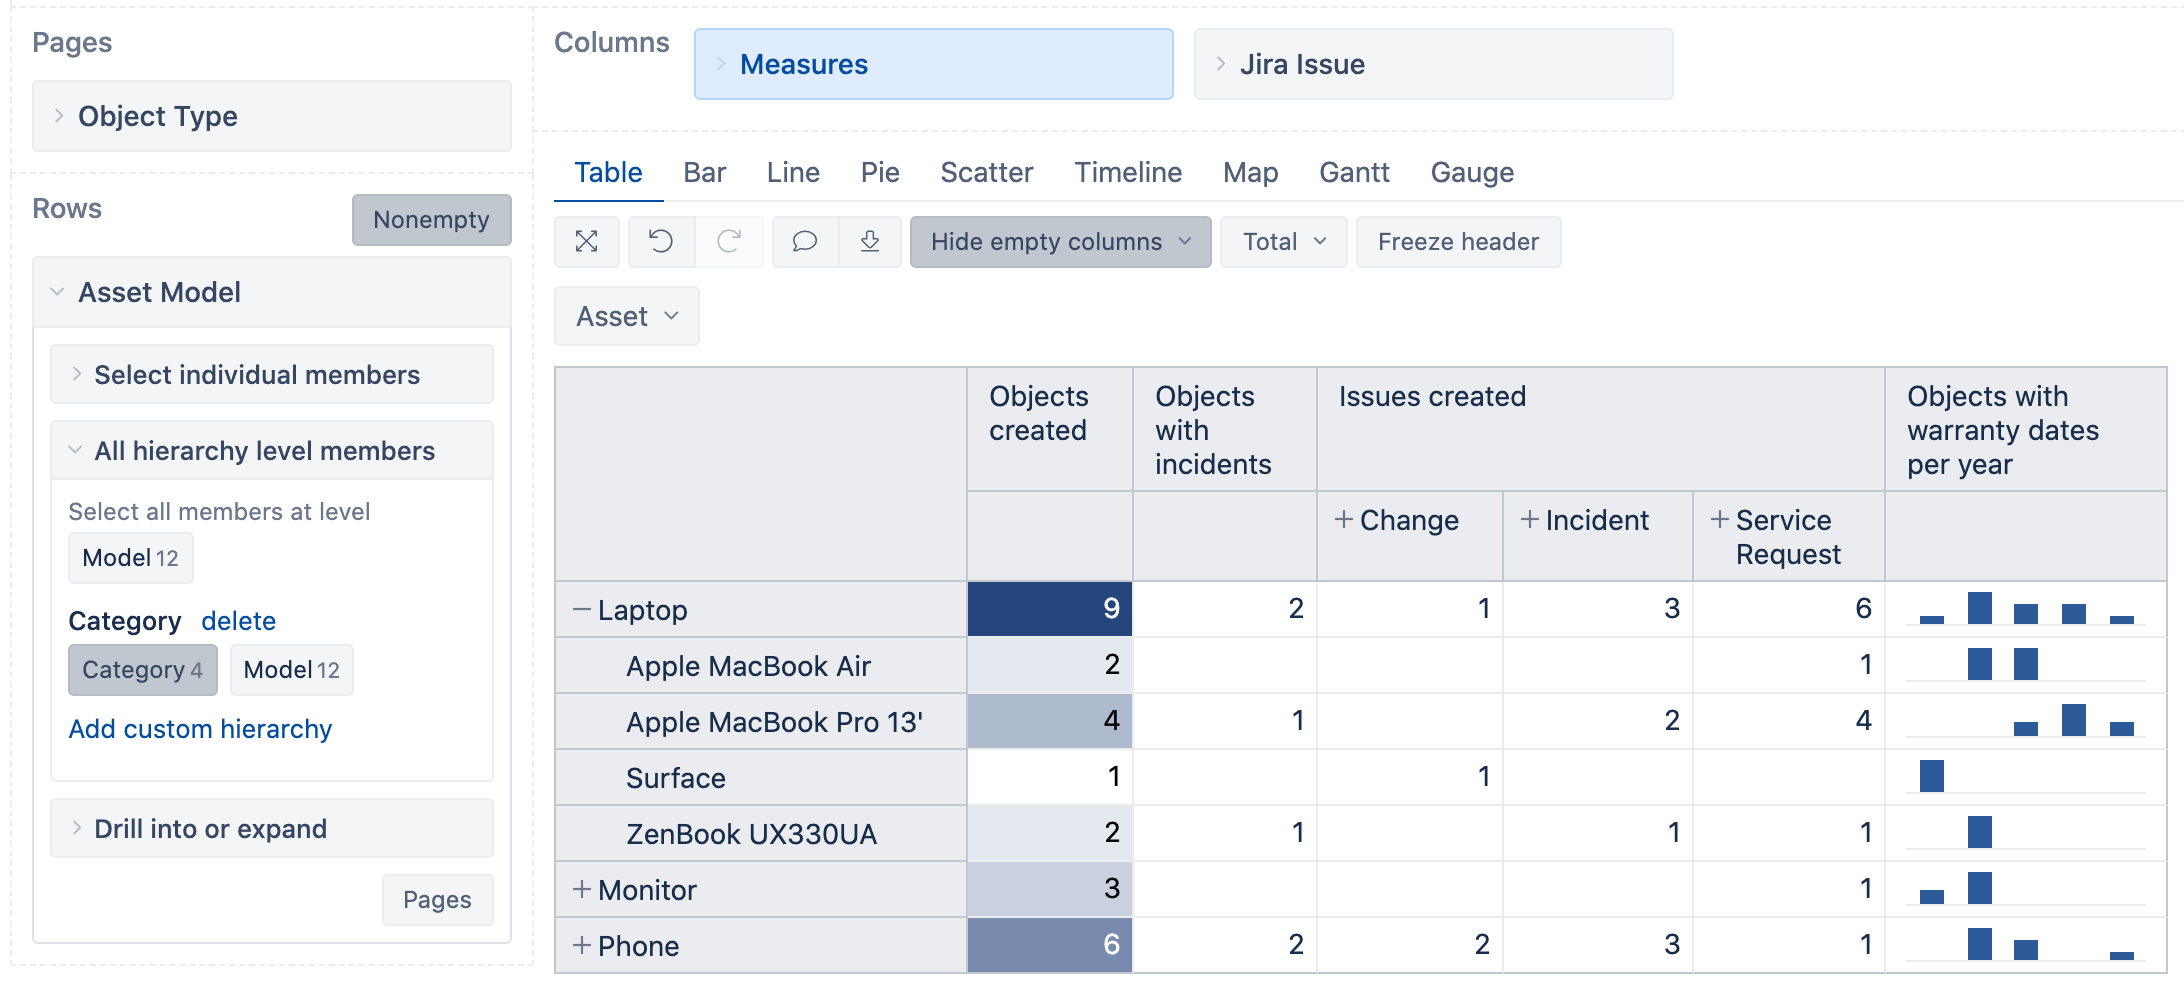
Find out the latest changes introduced for Insight reporting with eazyBI in our webinar recording. Also, read more about Insight attributes available for import in eazyBI in our documentation.
Zephyr Squad - Test Management for Jira
Zephyr Squad is the leading Jira test case management tool for scalable, agile software testing with a native Jira experience. Improve test planning and execution, synchronize test results, integrate with leading test automation and other tools, track coverage with traceability between requirements, tests, and defects.
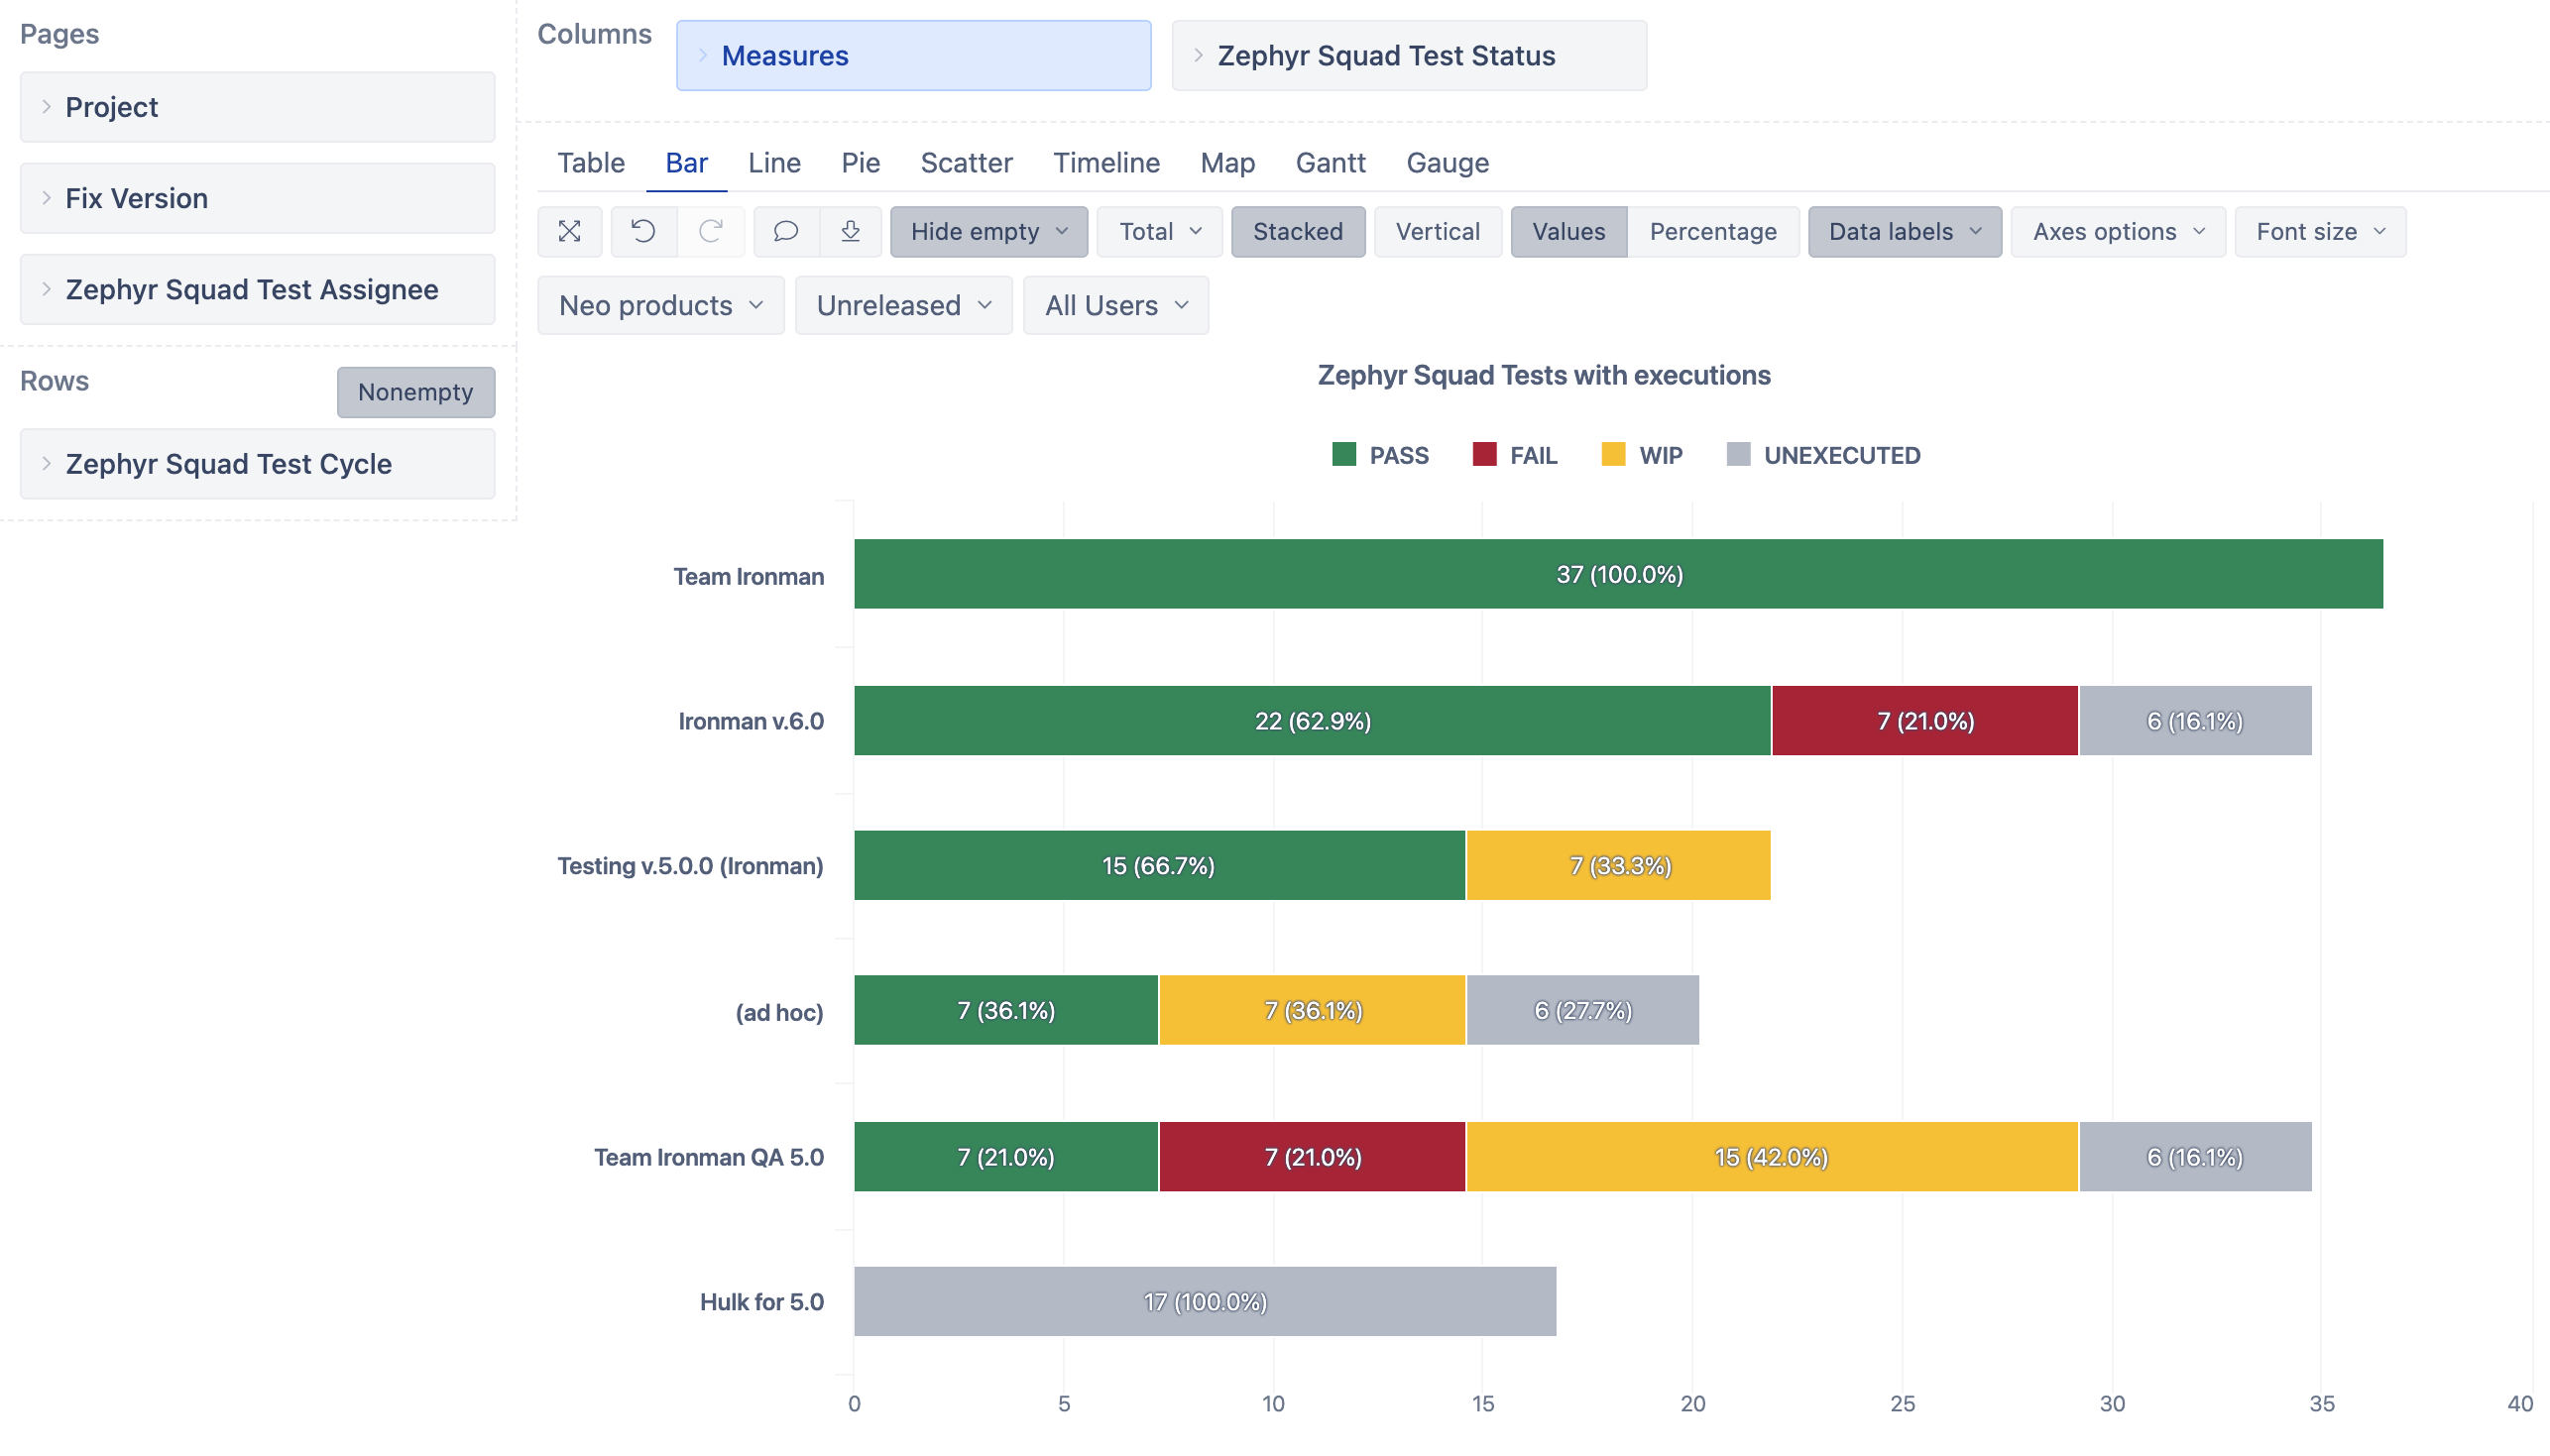
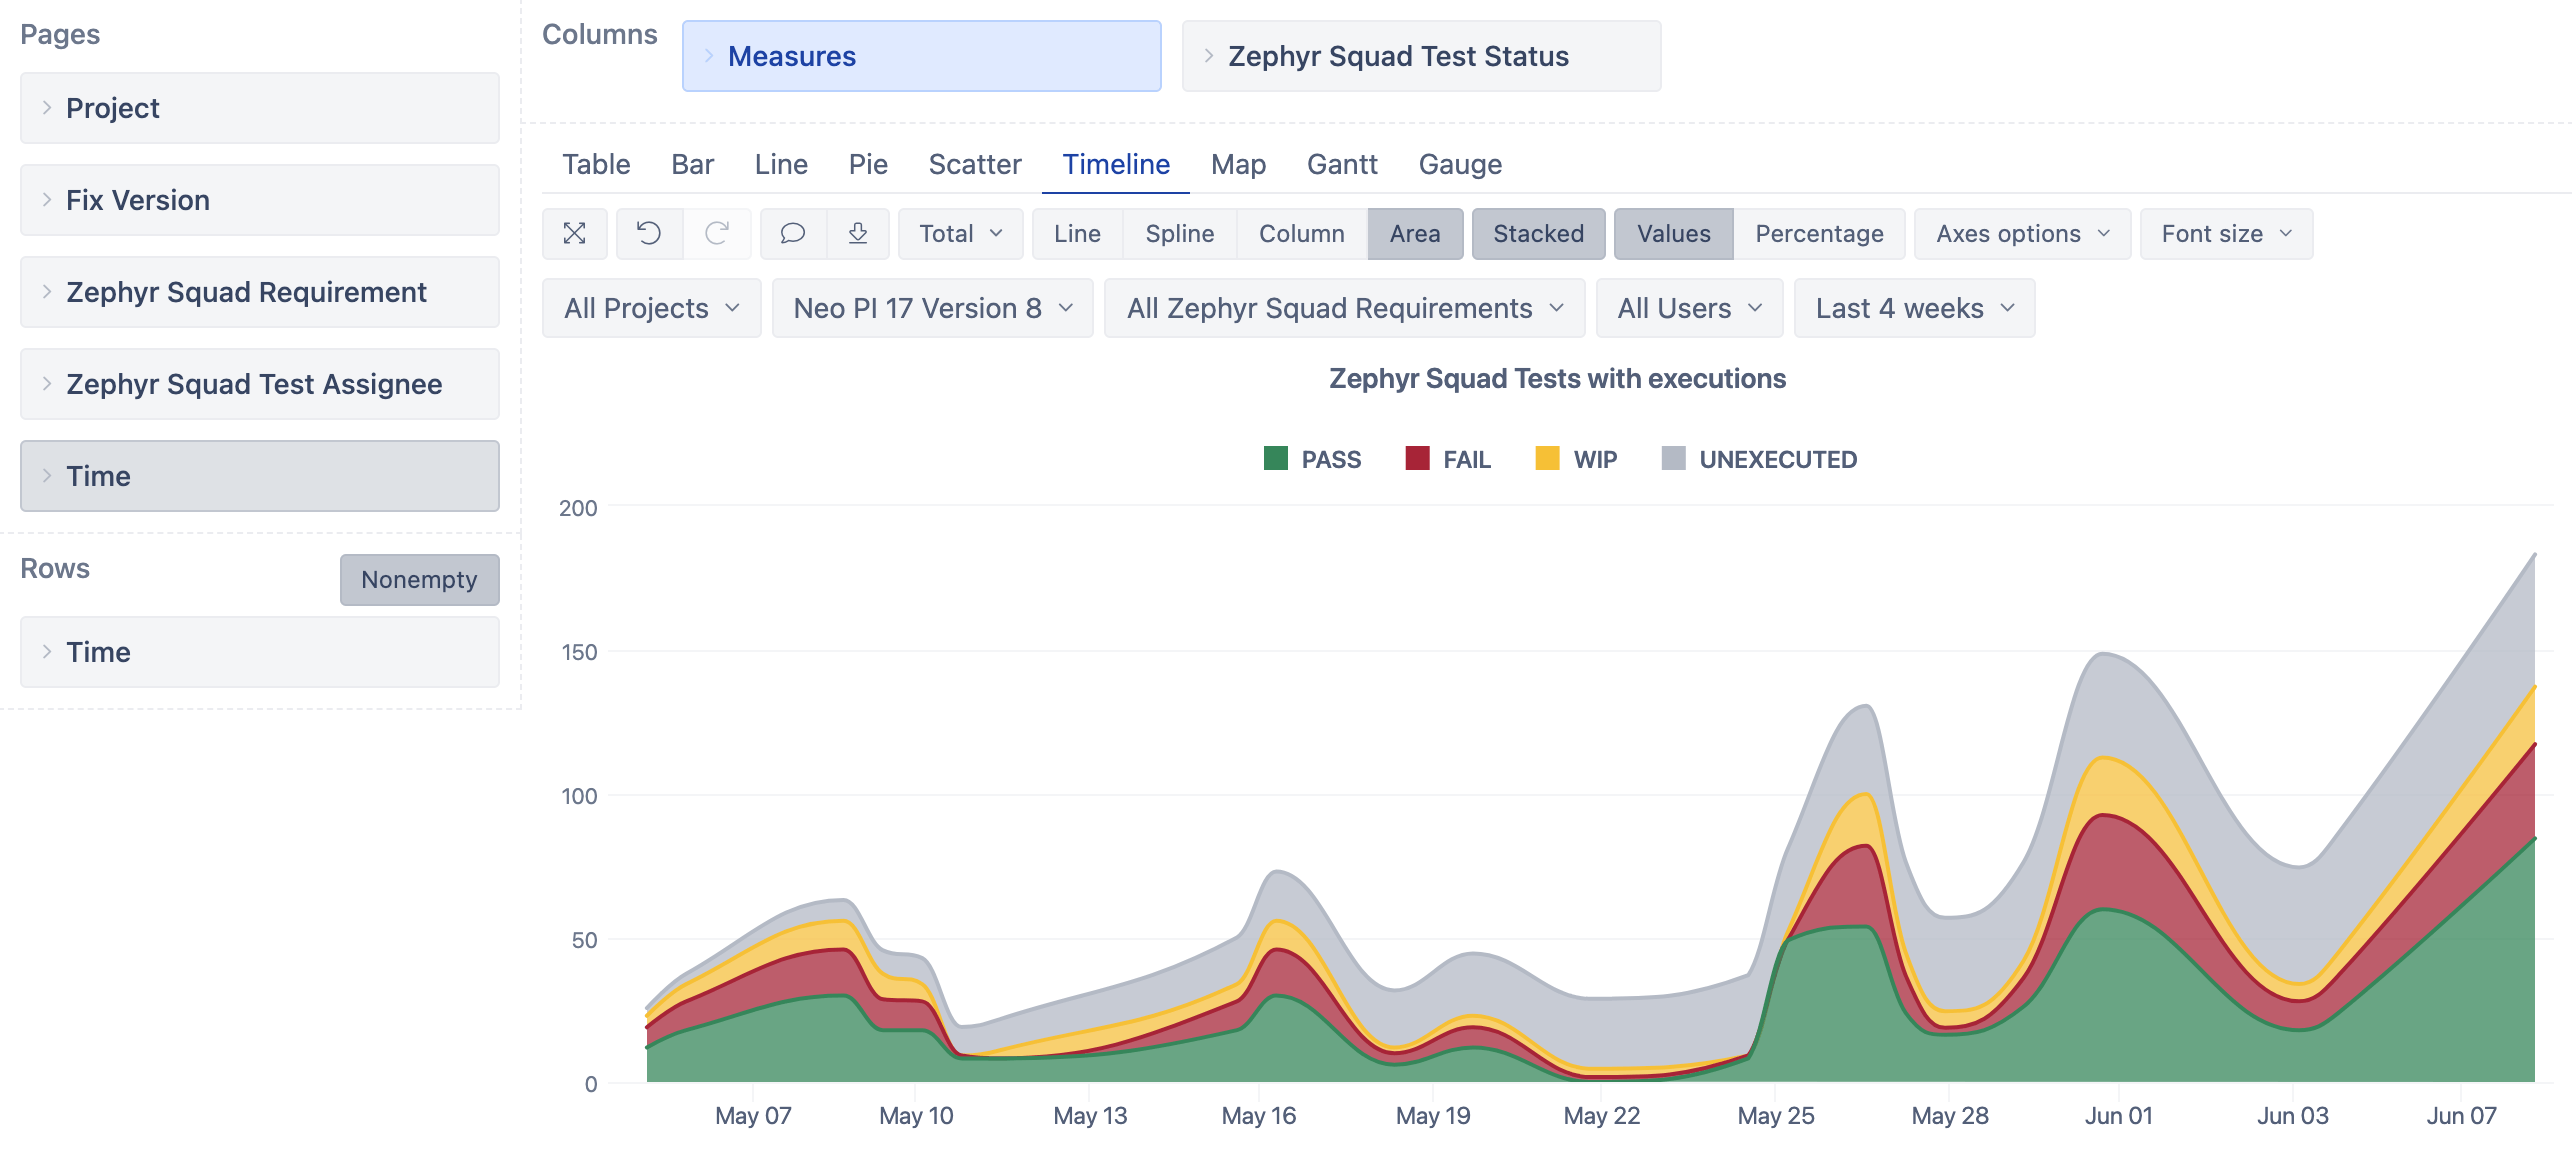
Step up your Jira test reporting with eazyBI – measure the progress of planned versions and requirement coverage based on test execution status, allocate top defects affecting the progress. Help the teams assign and track all test cases down to the detail with the eazyBI Reports and Charts app. Learn more about Zephyr Squad reporting with eazyBI.
Zephyr Scale - Test Management for Jira
A scalable, performant test management solution inside Jira with advanced test planning, reporting, and reusability features. Manage & reuse tests at scale, benefit from advanced reporting & auditing, integrate across multiple tools & frameworks.
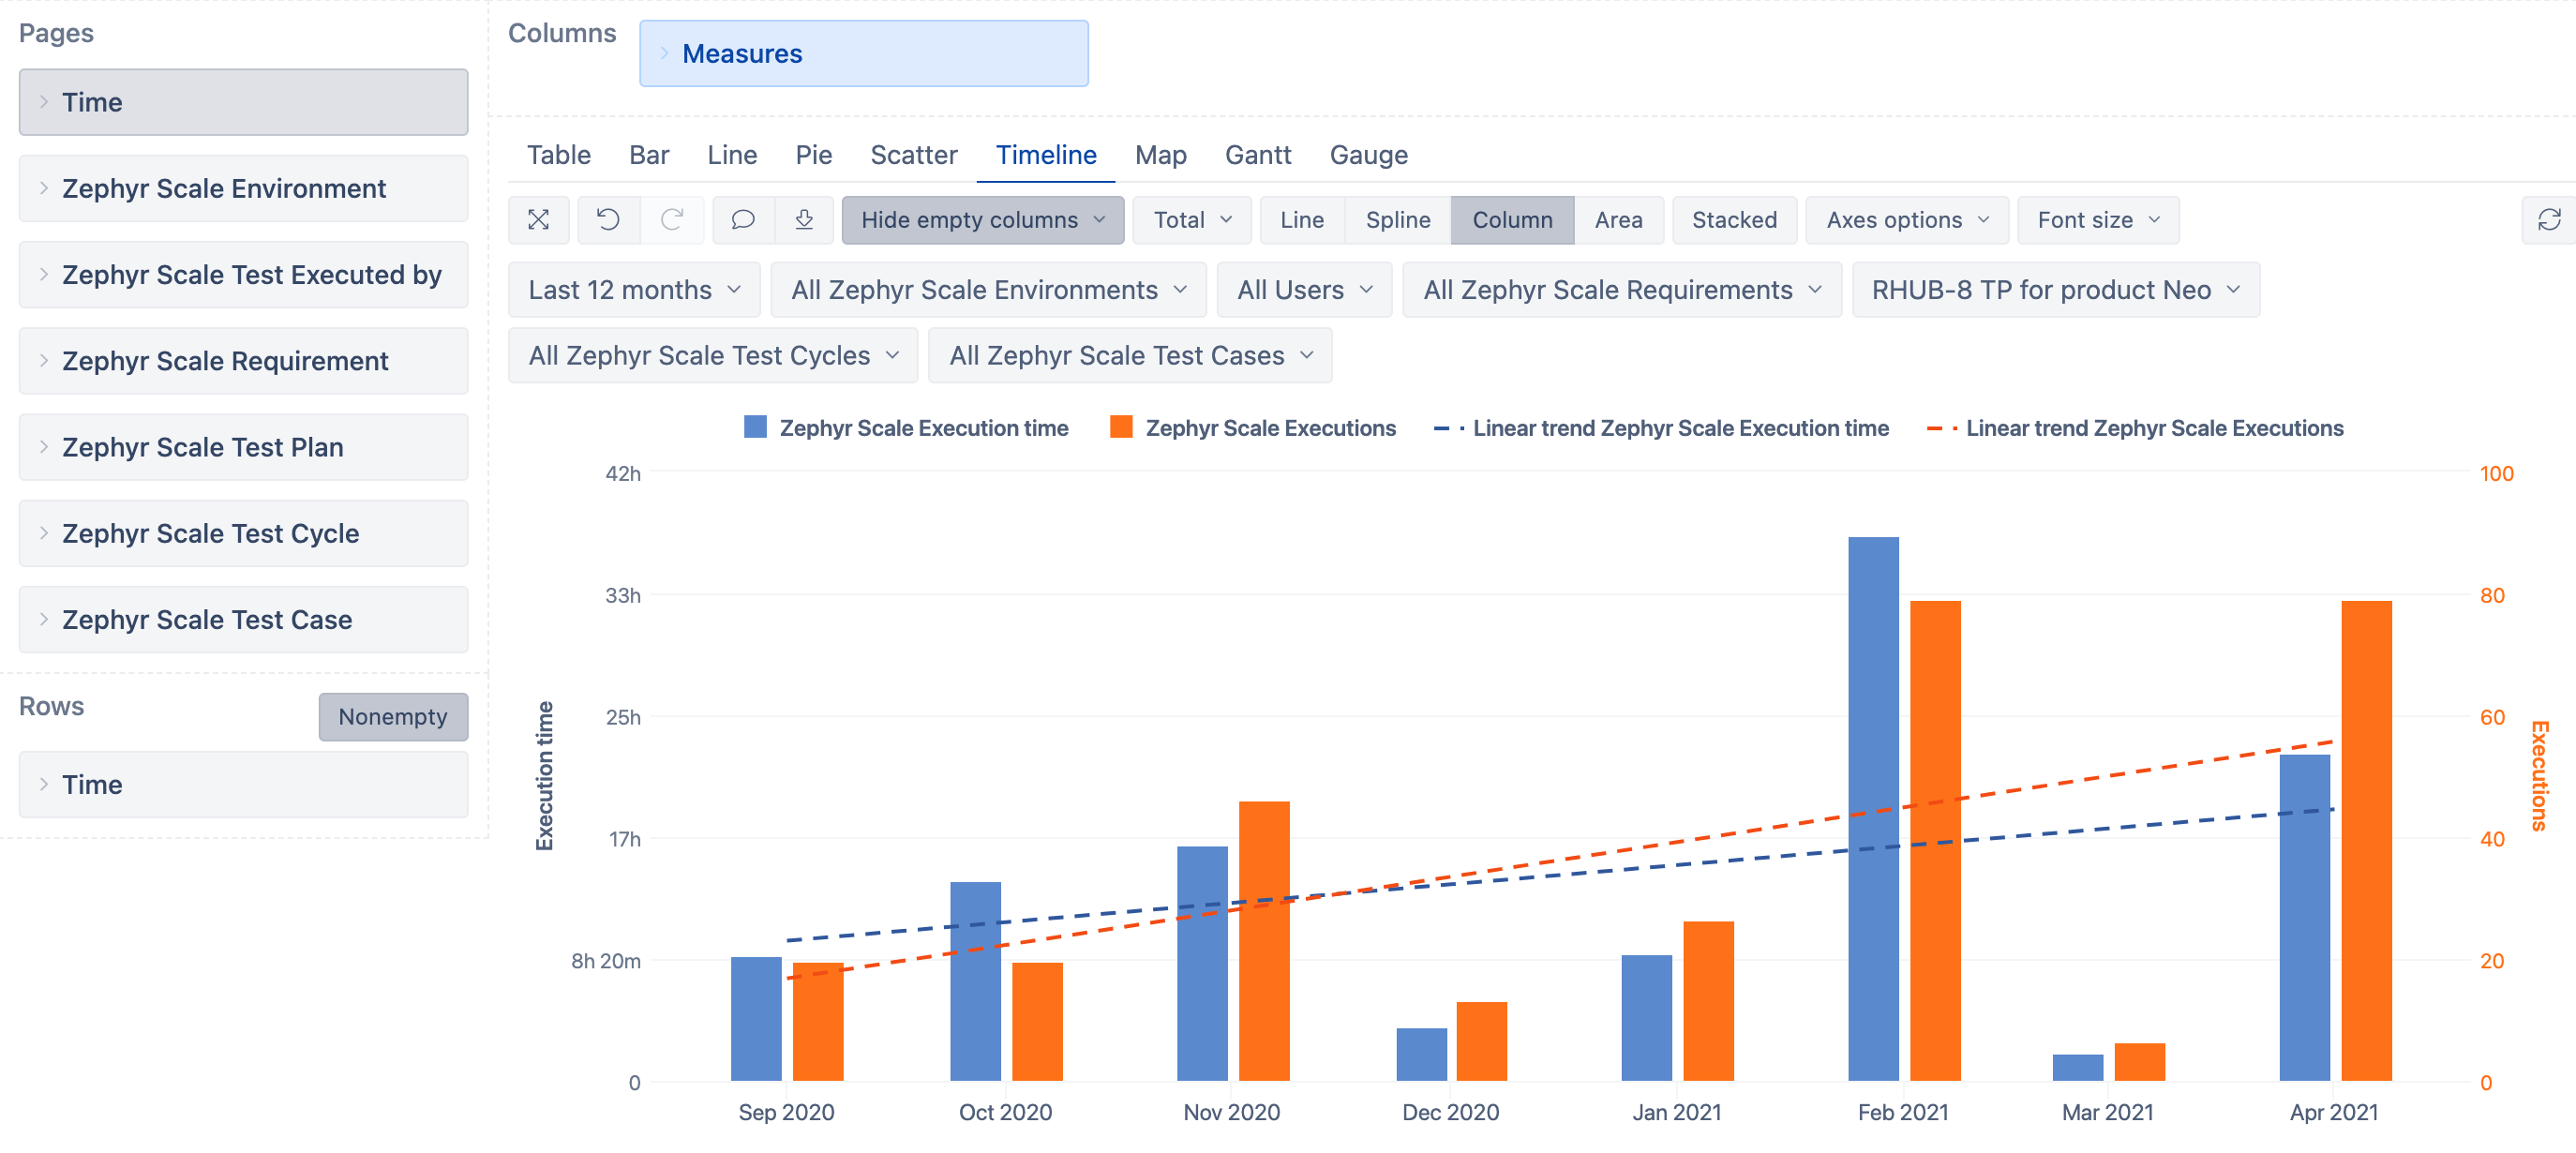
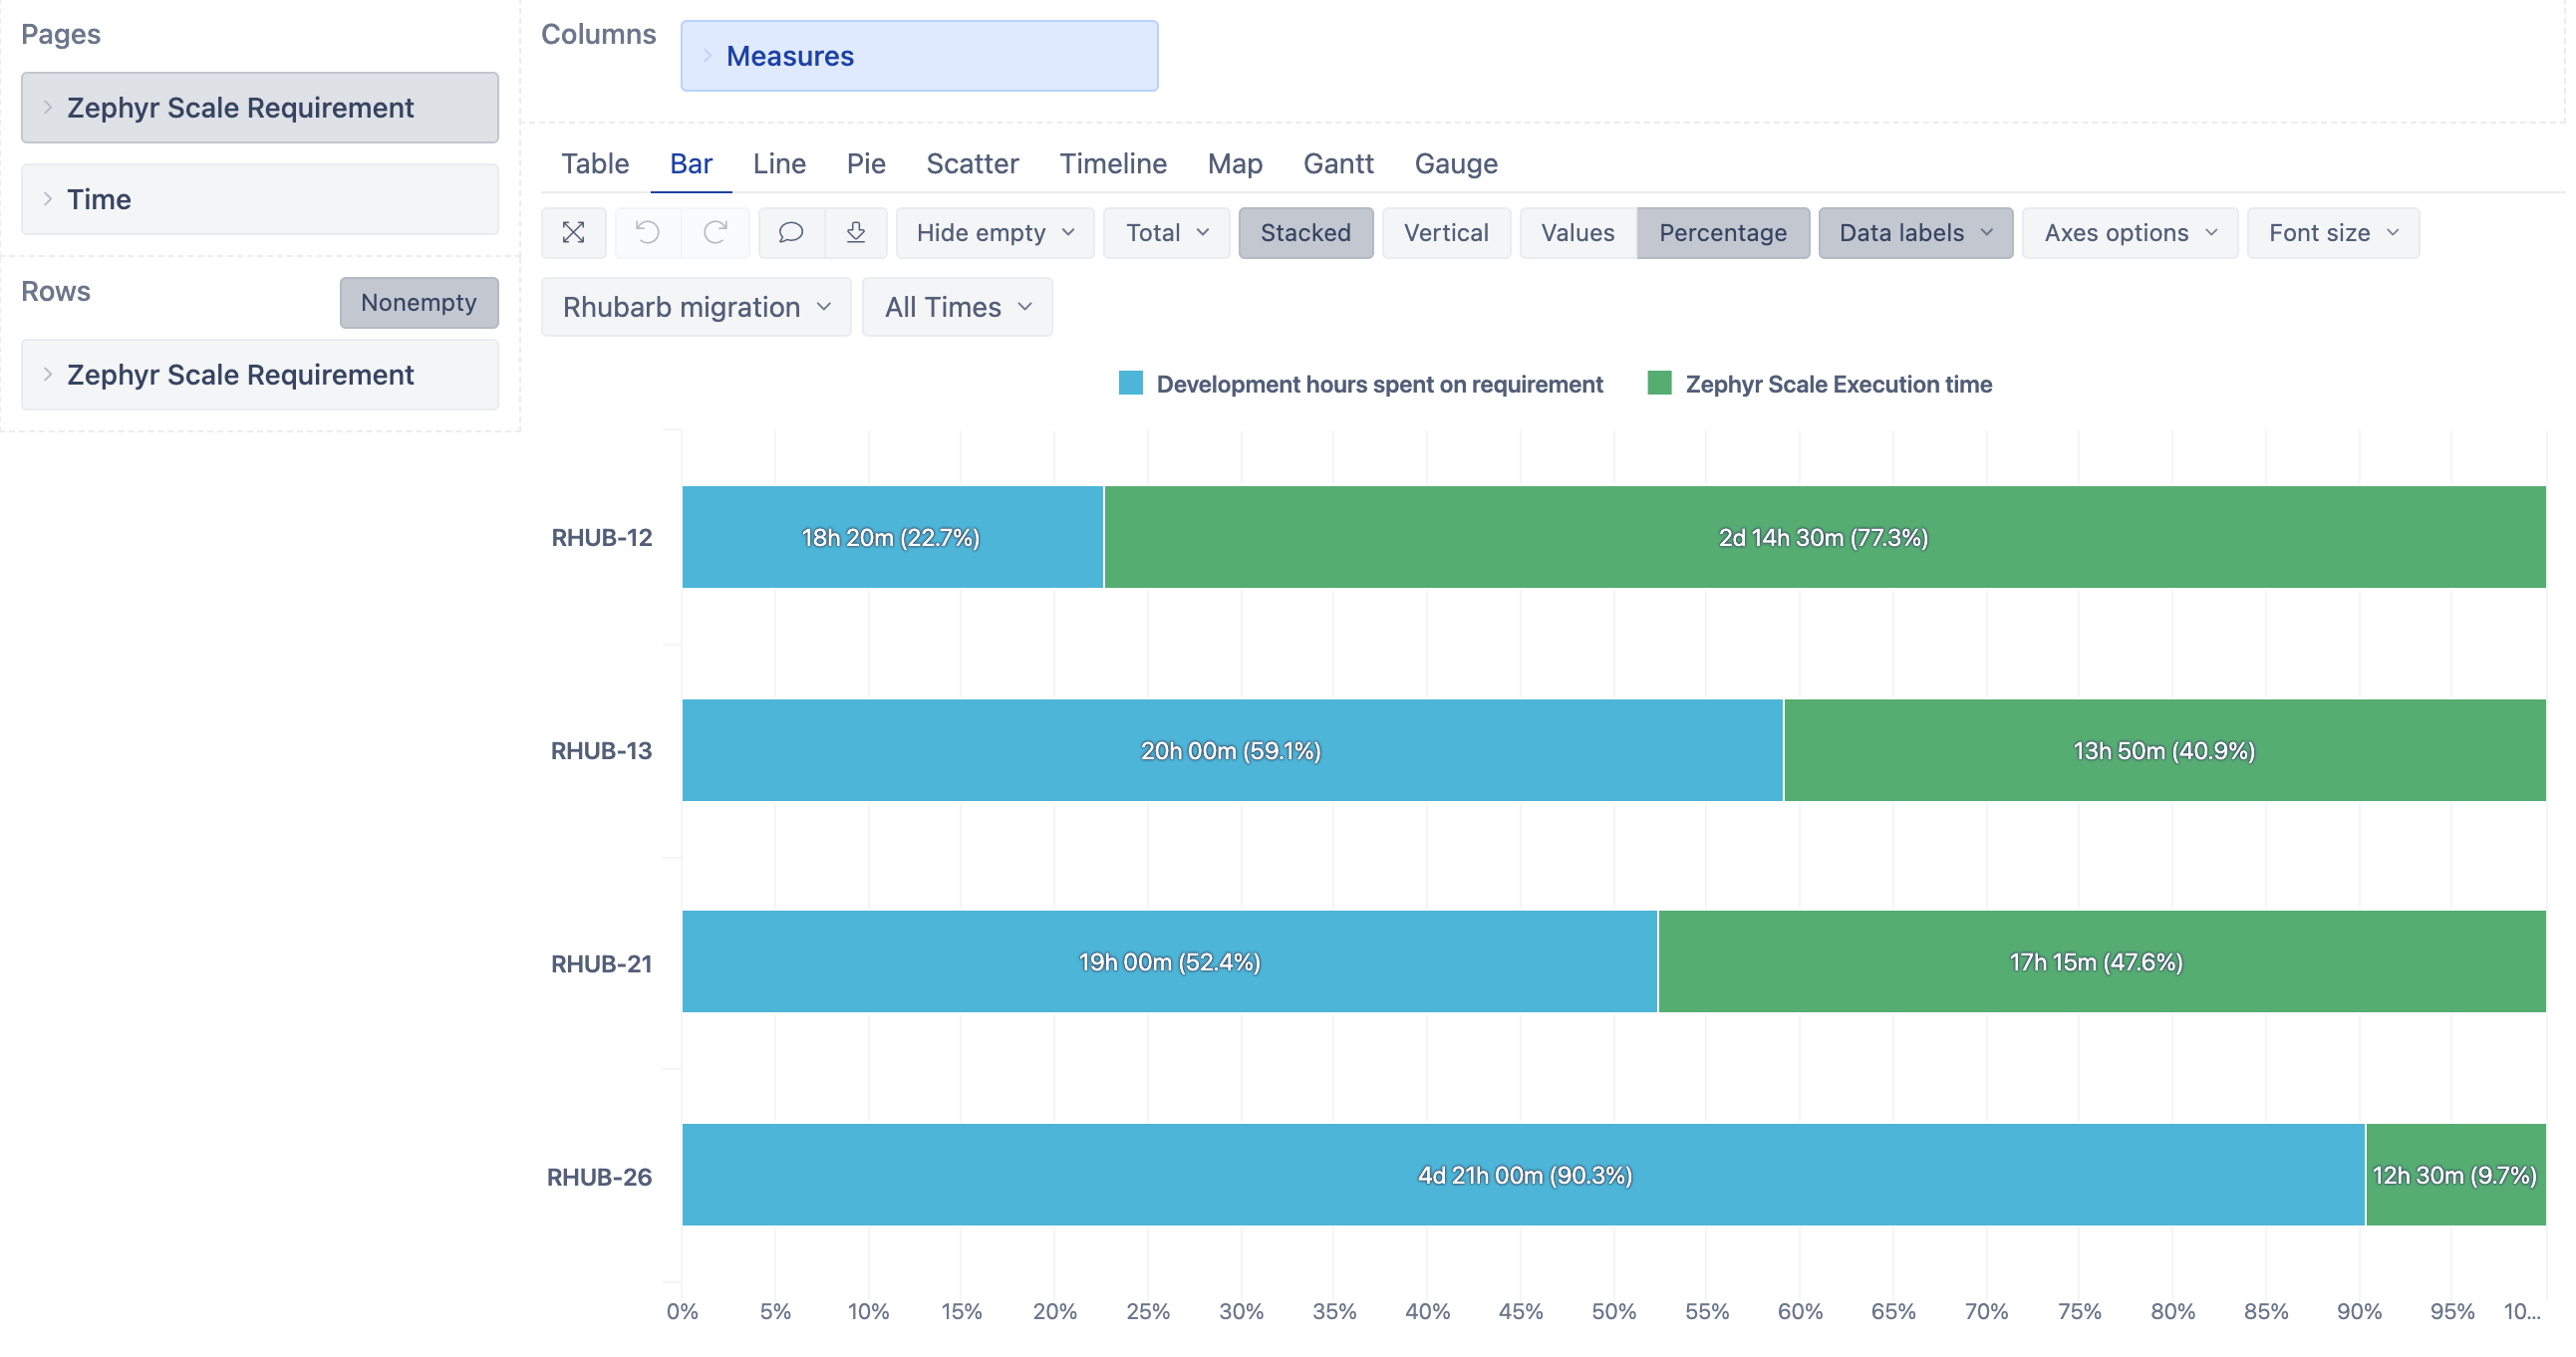
Create Jira test reports with eazyBI based on your test management data to highlight trends and quickly identify and locate testing issues, bugs, or possible improvements and threats. Analyze created, scheduled, executing, or executed Test Cases, Cycles, Runs, and Executions. Review Test Case properties like last execution dates, times, statuses, versions, created or scheduled dates, related issues, and more.
Answer all the questions on the project's progress, coming from testing managers, development managers, project managers, and stakeholders. Find out more about Zephyr Scale reporting with eazyBI in the documentation.
Projectrack - Project Tracking for Jira
Projectrack is a popular project tracking and management app for Jira. Visualize your Jira project portfolio at a glance, track, categorize, and make decisions through different views. Create new properties to follow up on your project status, due dates, people involved, and much more!
Use eazyBI to define your custom project properties as text, number, date, or list values and import those details into eazyBI together with all your Jira issue data for a comprehensive project reporting and analysis. Create reports on a project or cross-project level, combine multiple dimensions in one chart to create new insights and compare the status, and more.
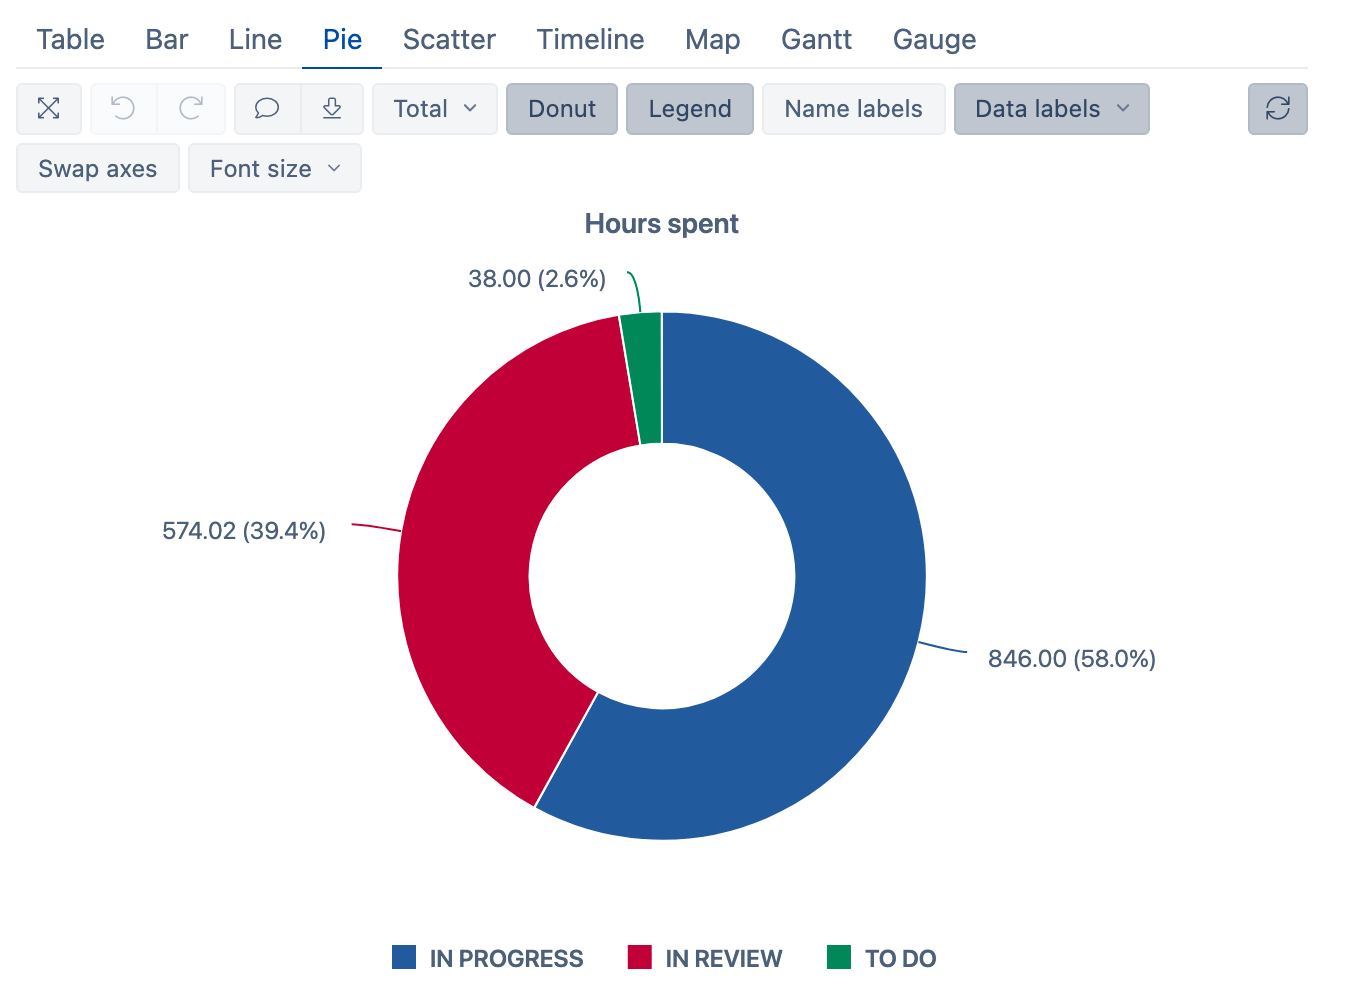
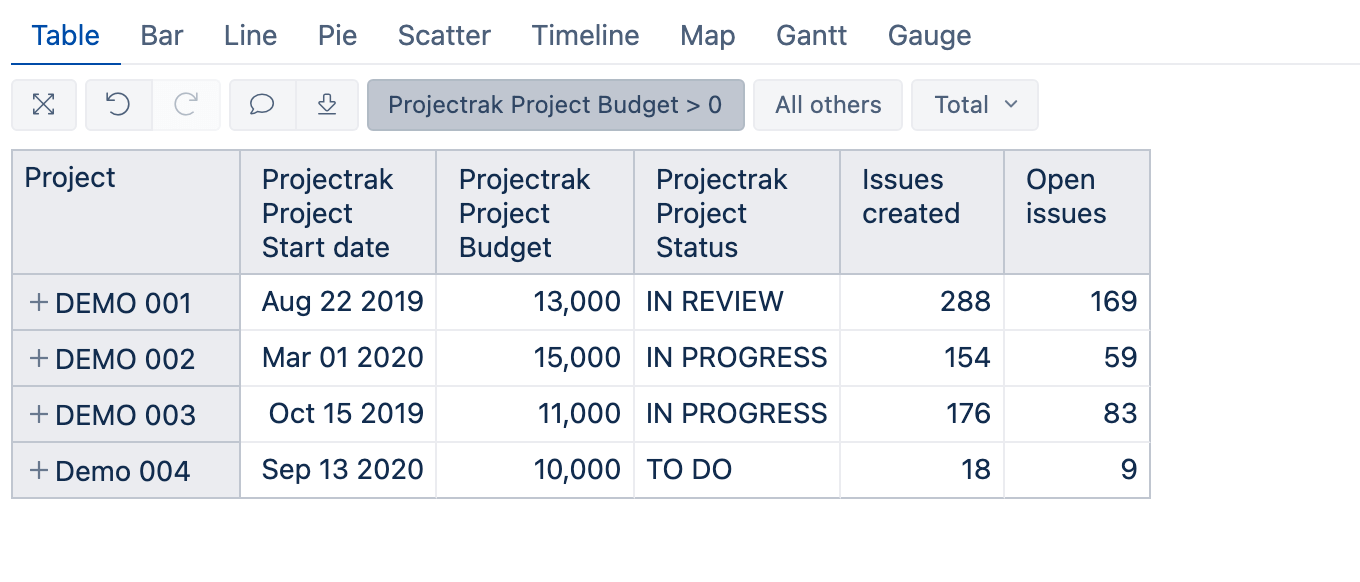
Read more about Projectrack reporting with eazyBI on our documentation site.
Xray Test Management for Jira
Cutting Edge Test Management for Jira. Built for every member of the team to plan, test, track, and release great software. Xray for Jira is complete, Atlassian verified test management app for Jira. Xray supports manual and automated tests and a complete testing life cycle: test planning, test designing, and test execution to help developers improve the quality of their systems.
Use eazyBI to measure created, scheduled, executing, or executed tests, as well as test runs, defect counts, or last execution properties like date, status, duration, environment, and more. Create test reporting in Jira, including Requirements, Test Plans, Sets, Statuses, Types, Defects, Assignees, Environments, etc.
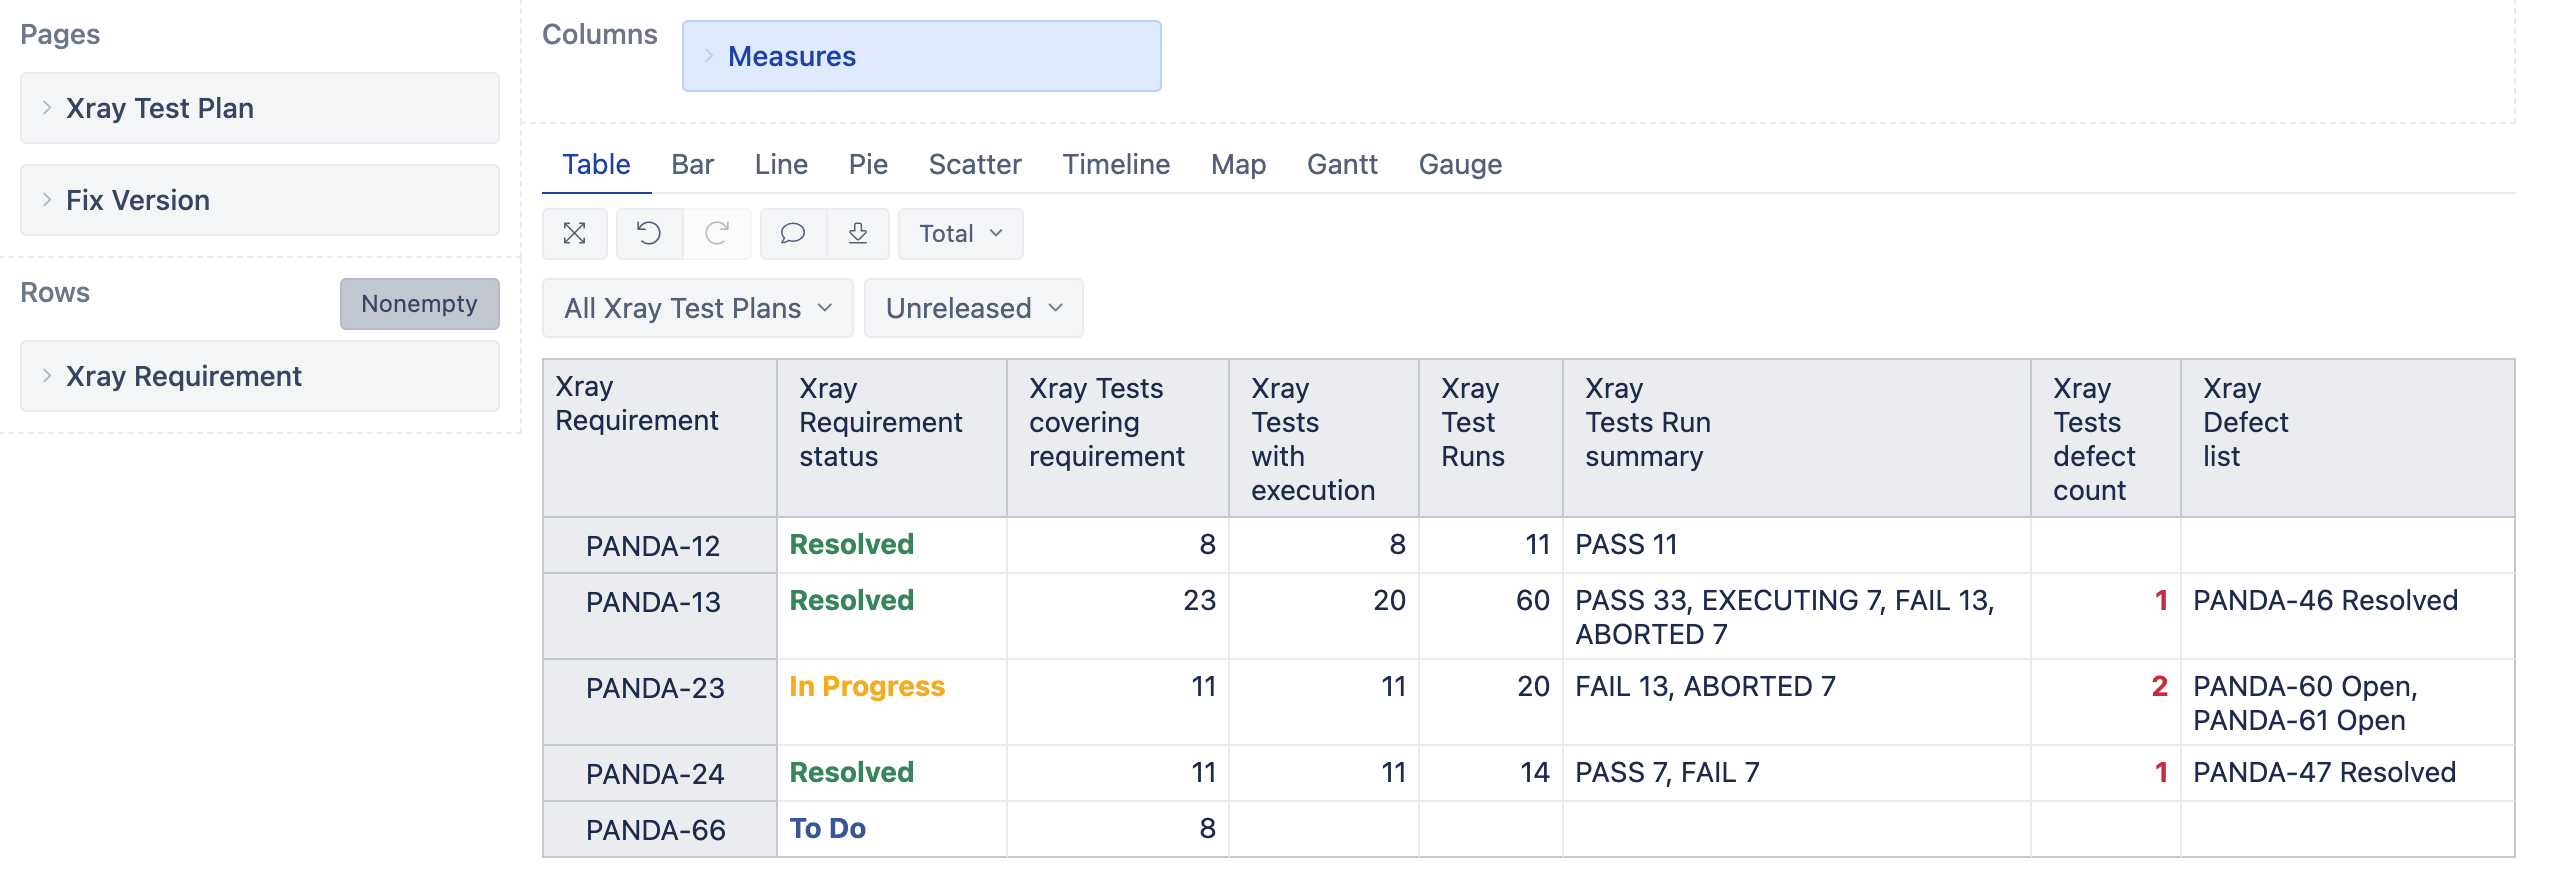
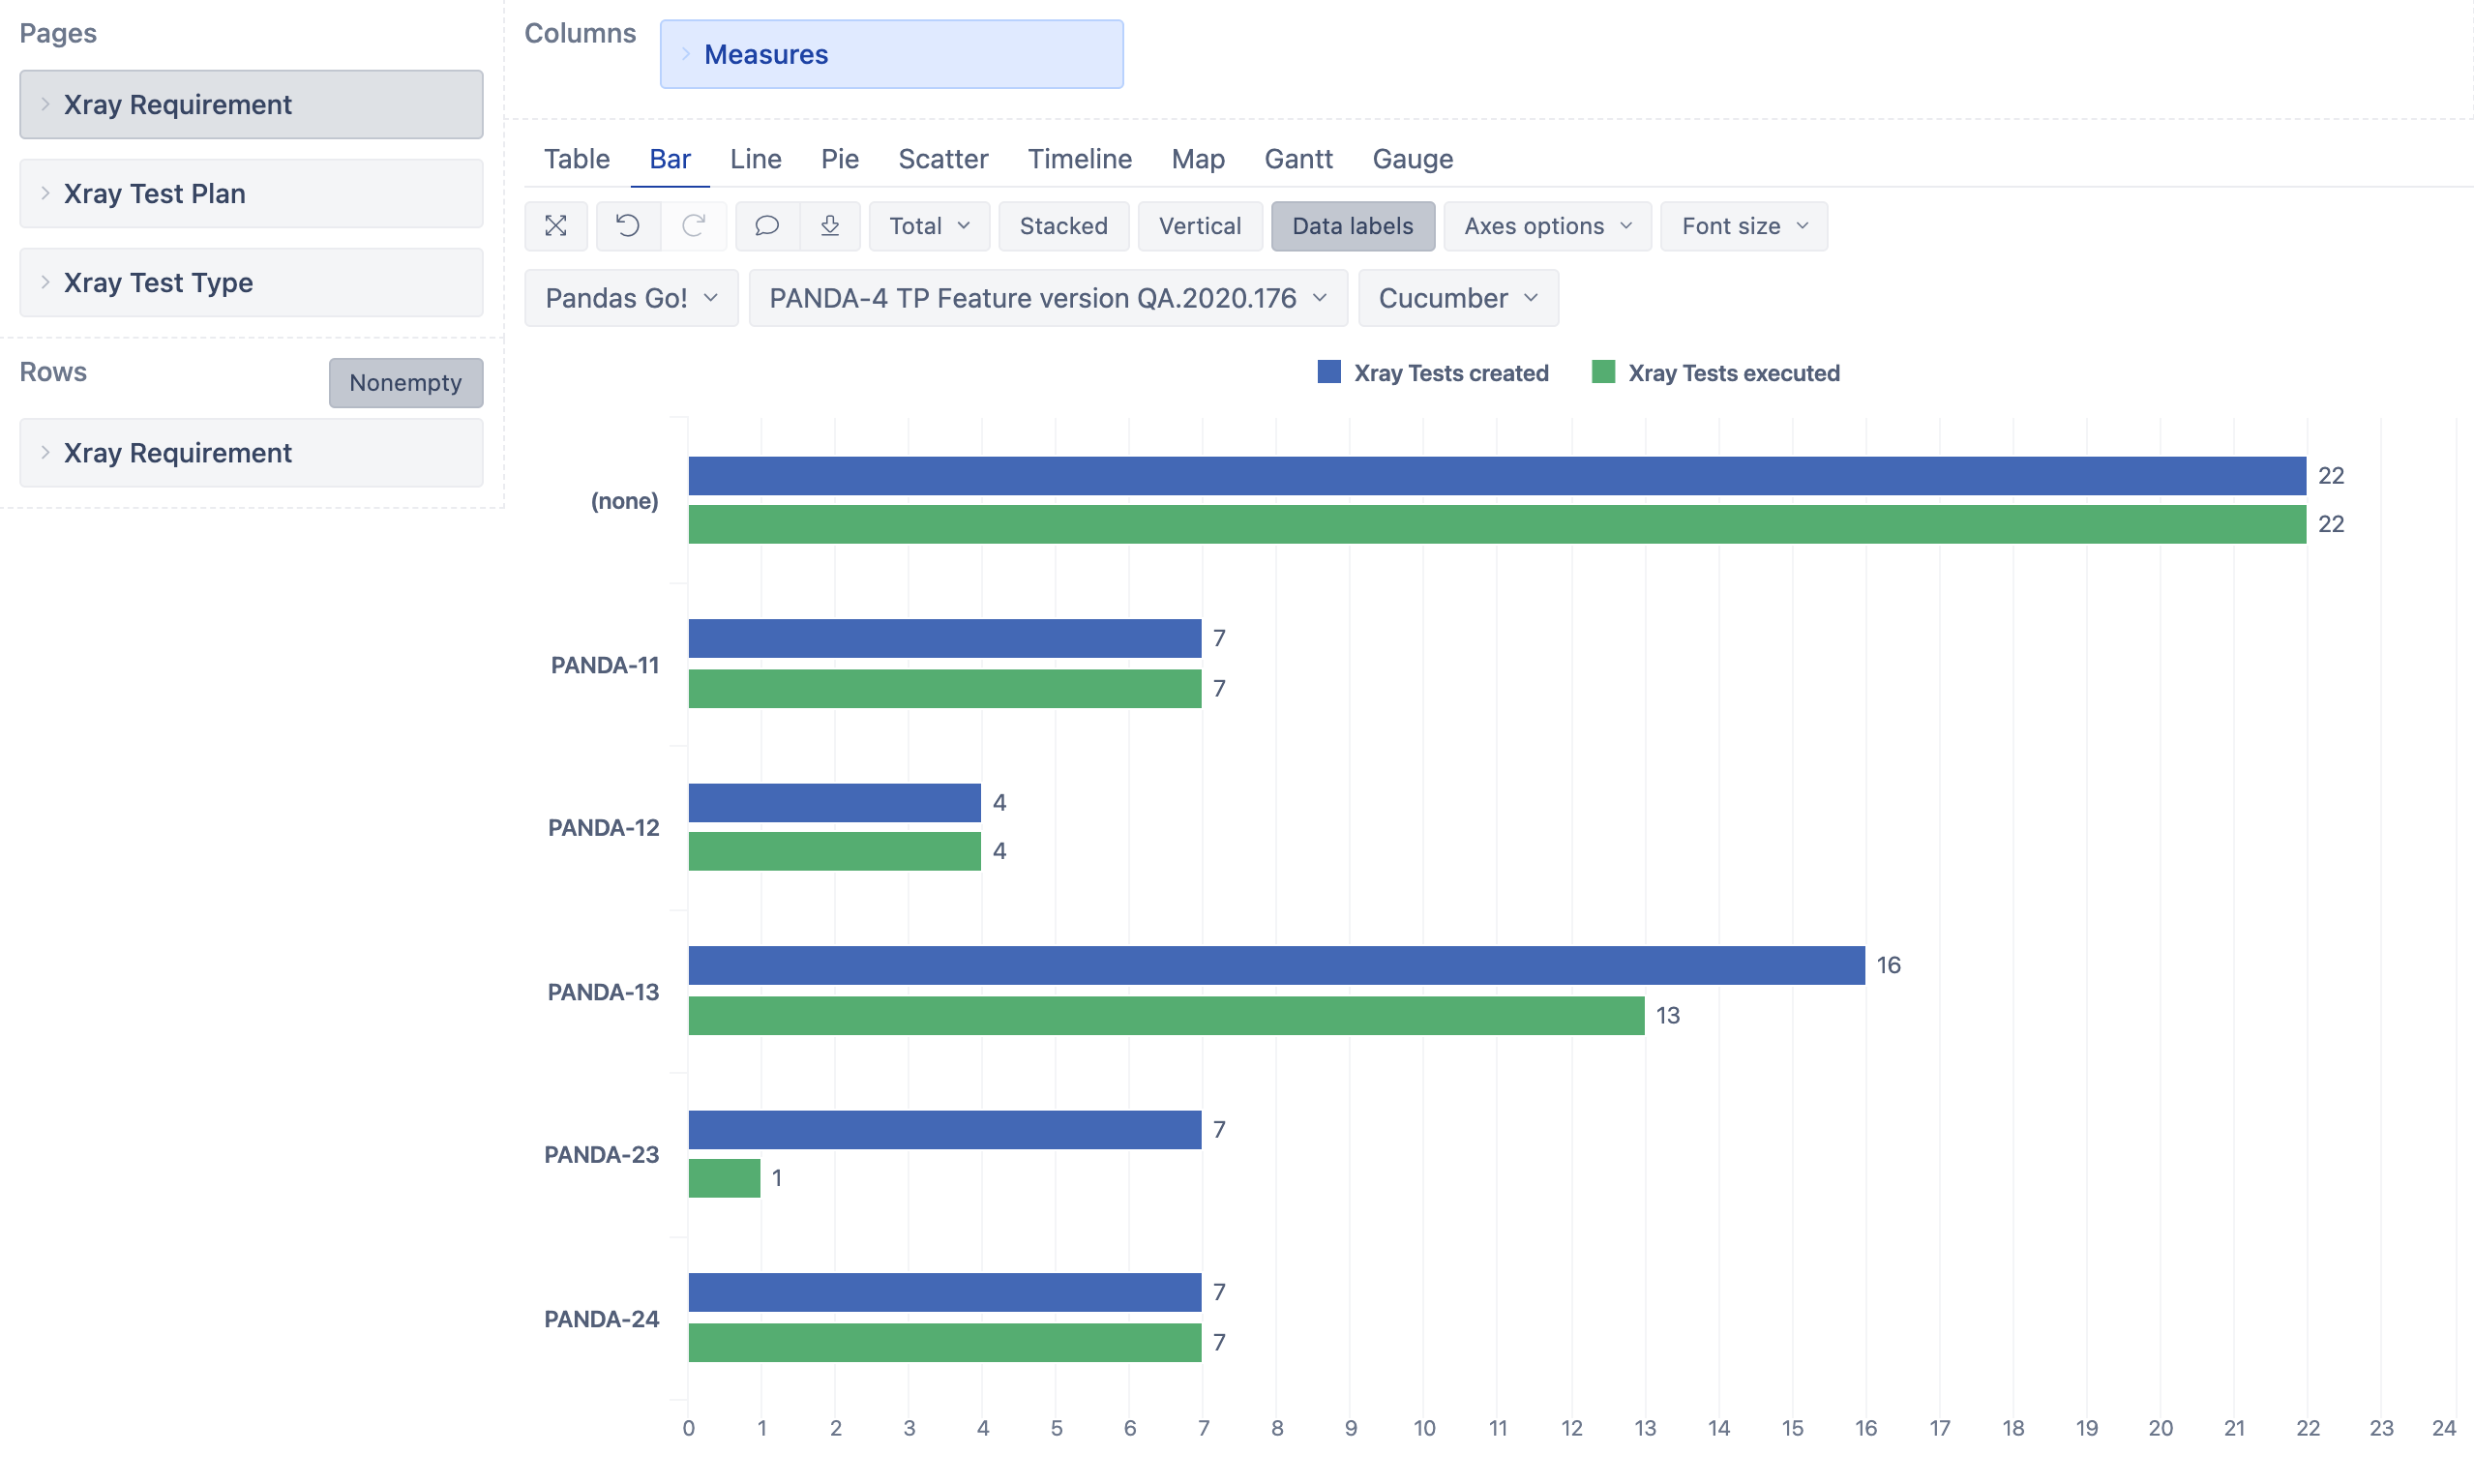
Read more about Xray Test Management for Jira reporting with eazyBI on our documentation site or read our latest blog post and find out how Xray data is organized in eazyBI and explore Xray report samples built with eazyBI.
Bitbucket, Bamboo
Bitbucket is more than a Git code management. Bitbucket guides teams through the development process, giving them one place to plan projects and collaborate on code. Use Bitbucket together with Bamboo to provide continuous integration with testing, deployment, and delivery. Automate and integrate the processes between software development and IT teams to build, test, and release software faster and more reliably.
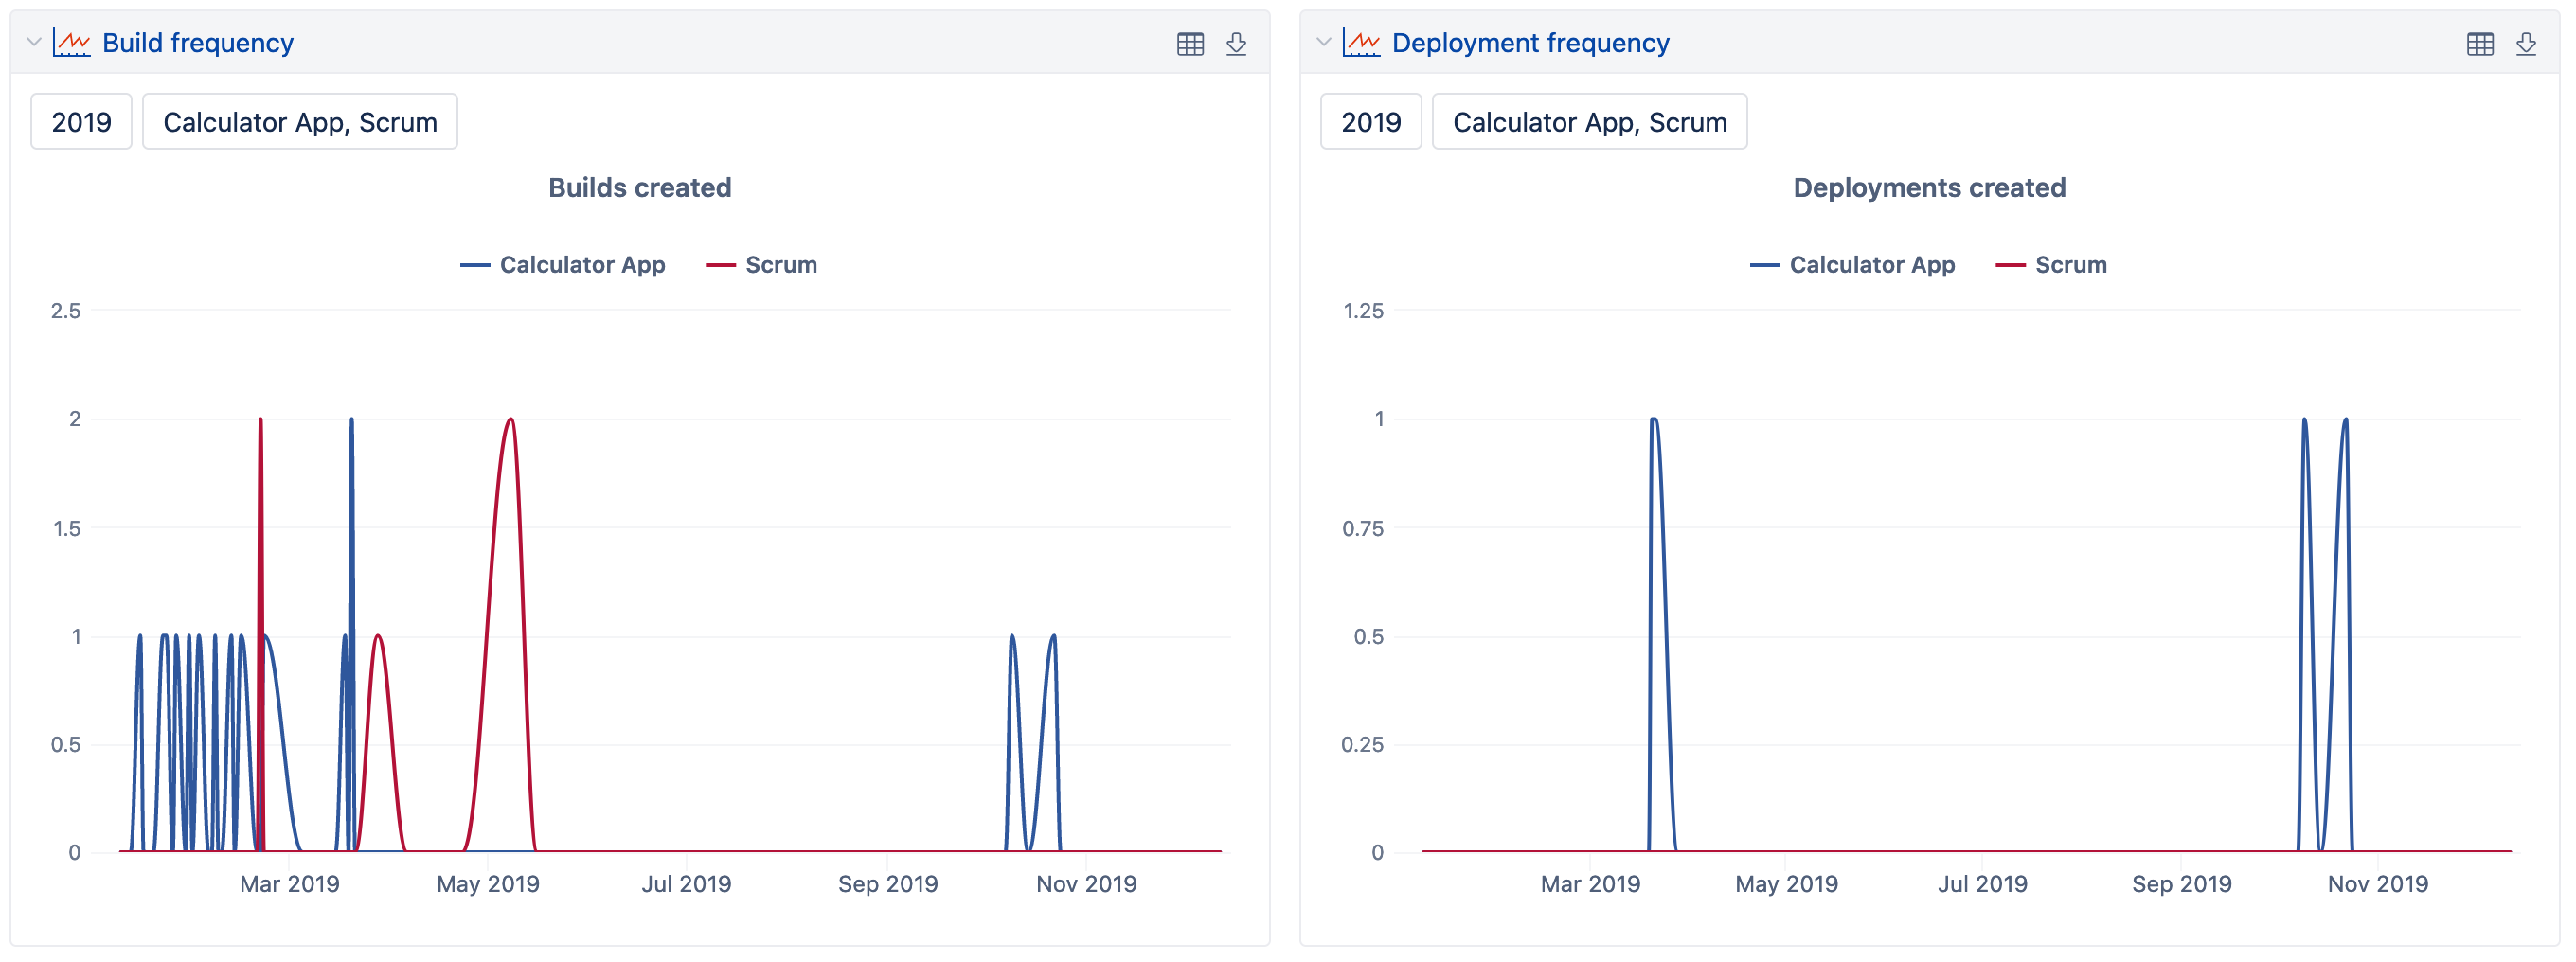
Use eazyBI to measure min, max, and average times for pull request development, wait and review, build, and deployment executions. Display Bamboo build and deployment information as well as the frequency on a timeline. Measure Average or Total recovery time with Incident issue types, analyze how often bugs in production happen or reappear and how often you encounter issues in the deployment process.
 \
\
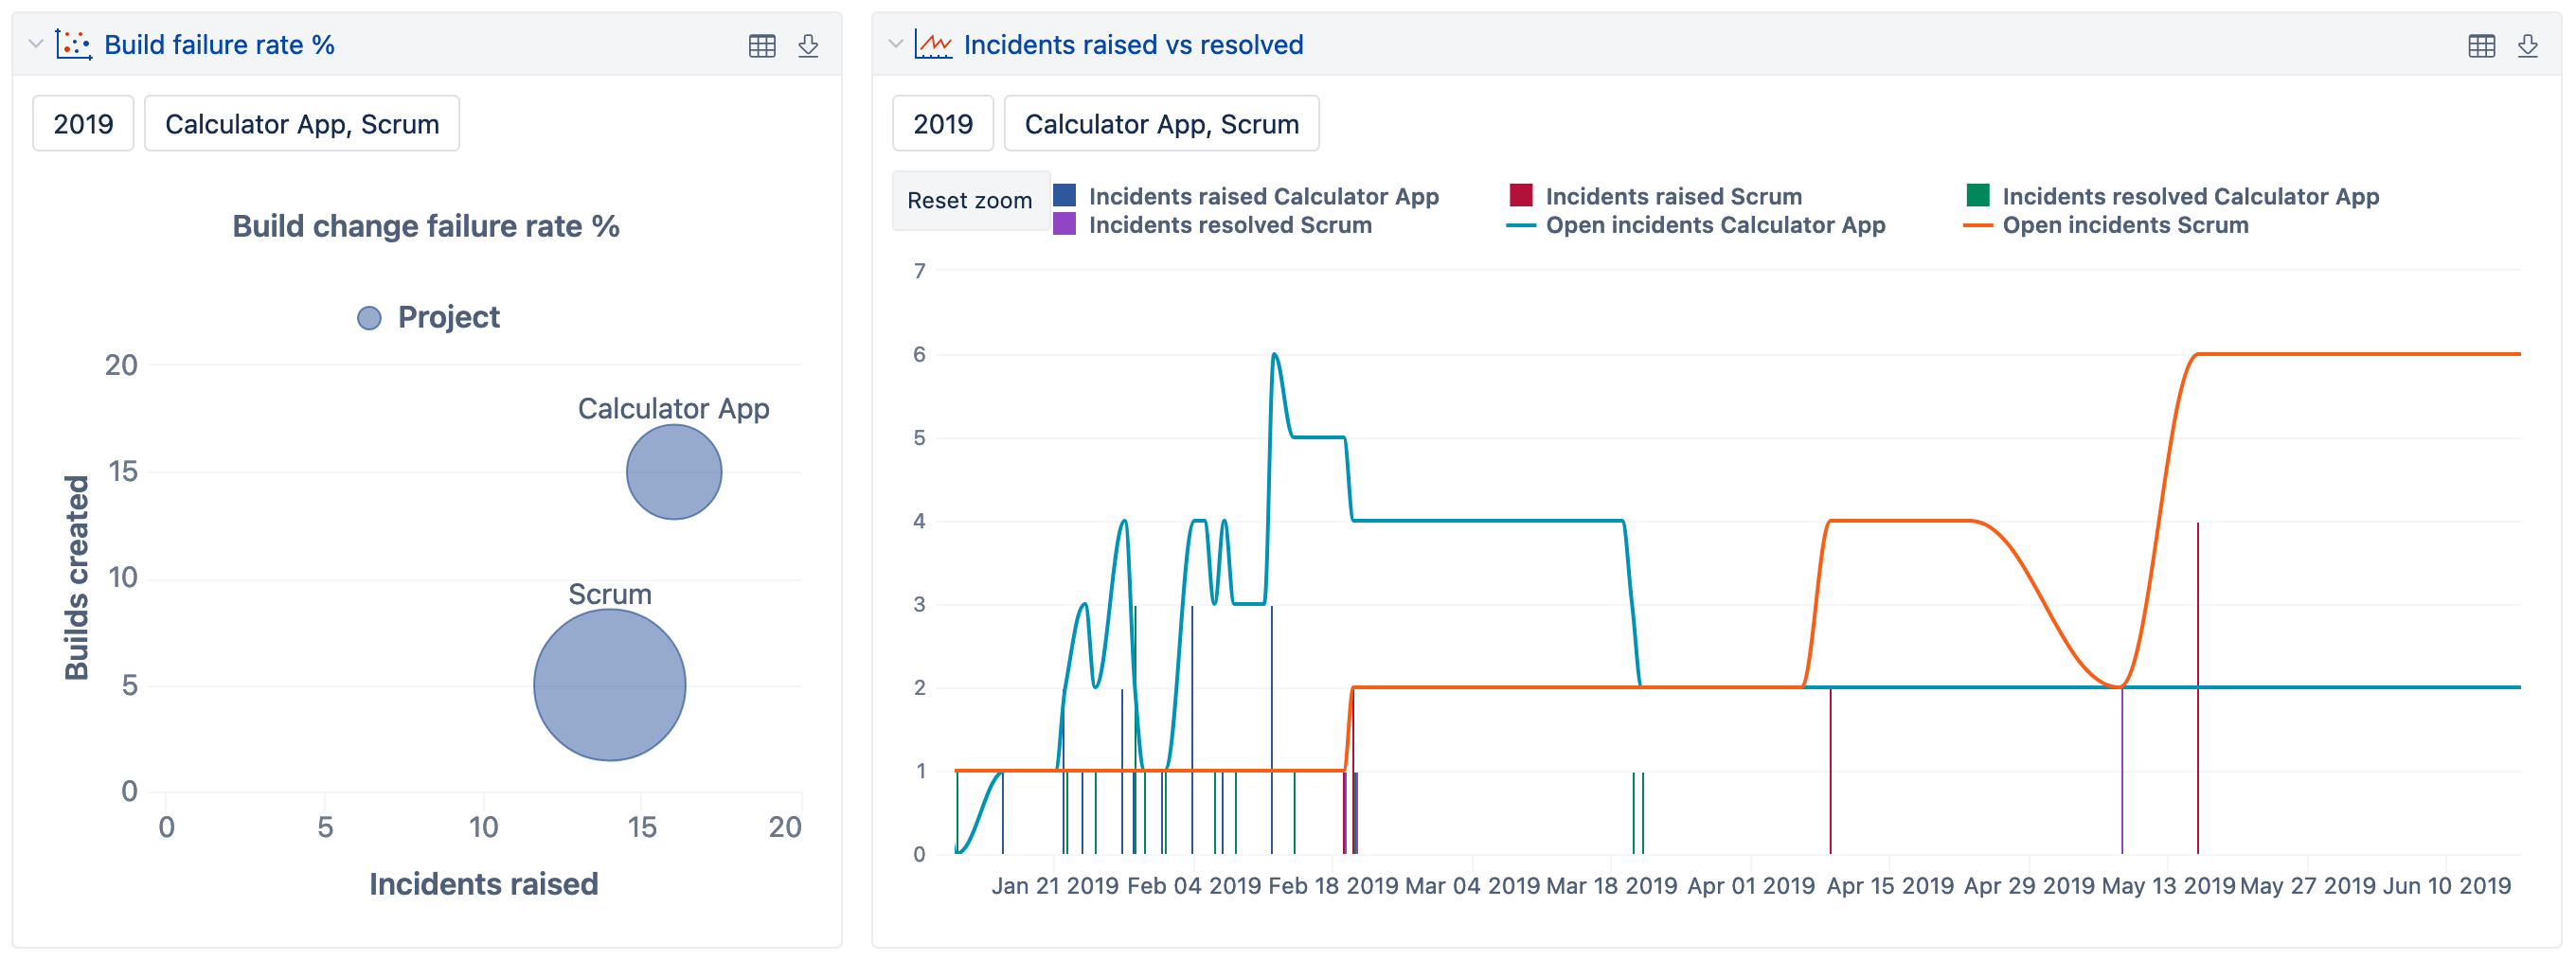
Find out more about Bitbucket and Bamboo integrations with eazyBI in our documentation.
Jira Calculated and Scripted Custom Fields
You can display data based on computed or imported custom field values in Jira to support any number of use cases. At Atlassian Marketplace, you can find several Jira apps that let you create calculated custom fields for issues like Scriptrunner for Jira, Jira Misc custom fields, Elements Connect, Power Scripts, and others. You can analyze any scripted custom fields with eazyBI.
eazyBI automatically detects custom fields during data import. Select them and import them as dimensions and/or properties for “Issue” dimension members.
Scripted field finds the Position list of all linked Stories or Requirements. In eazyBI, we can have a report showing the number of issues by the Position of the linked Story or Requirement.
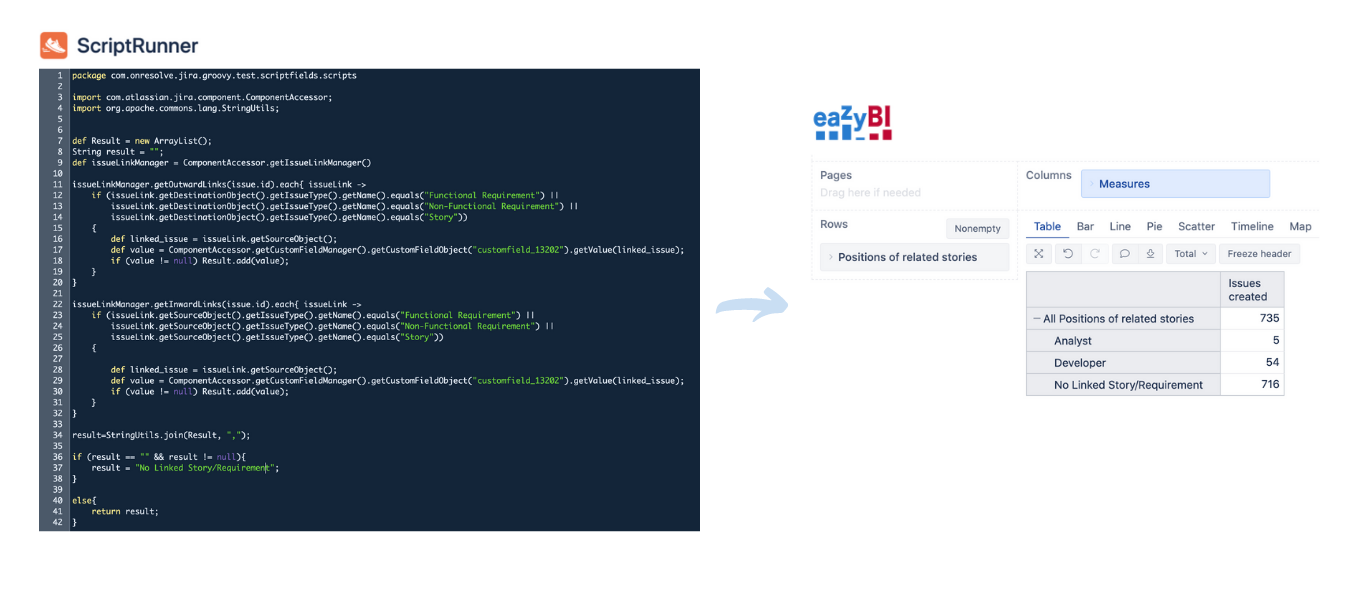
Find out more about Jira Calculated and Scripted Custom Fields import in eazyBI on our documentation site.
Explore new horizons of Jira reporting by adding data from different sources and apps in eazyBI. Share your findings with business owners and all involved parties–publish Jira reports and dashboards on the eazyBI dashboard, Jira dashboard, or Confluence page using gadgets, or on any other website using iframe.
Gather all your data in one place, experiment, explore, and discover. Create the right set of reports and take your business to the next level based on data-driven decisions. Why not start today?
