
It’s Here - The Long Awaited eazyBI 6.5
At eazyBI, we have the principle of deploying new features as soon as possible. Cloud customers have already enjoyed some of the recent greatness, and finally, we released it in eazyBI version 6.5.
Issue Cycles
Frequently our customers ask about the time between two statuses. For example, when did issues go into the progress or testing phase? When did the phase end? How long was the development, and when did it end? And how many days or workdays did it take?
While there are options for getting days spent in statuses, complexity grows when a phase or a cycle includes time spent in several statuses. Considering the vast difference in workflows of eazyBI customers, we have developed an option to define Issue cycles. During data import, you can set which statuses are part of Analyze, Development, or Test phase. You can set as many custom cycles as your workflow requires. After data import, you will get a bunch of pre-calculated measures for each cycle and a hierarchy in Status dimensions.
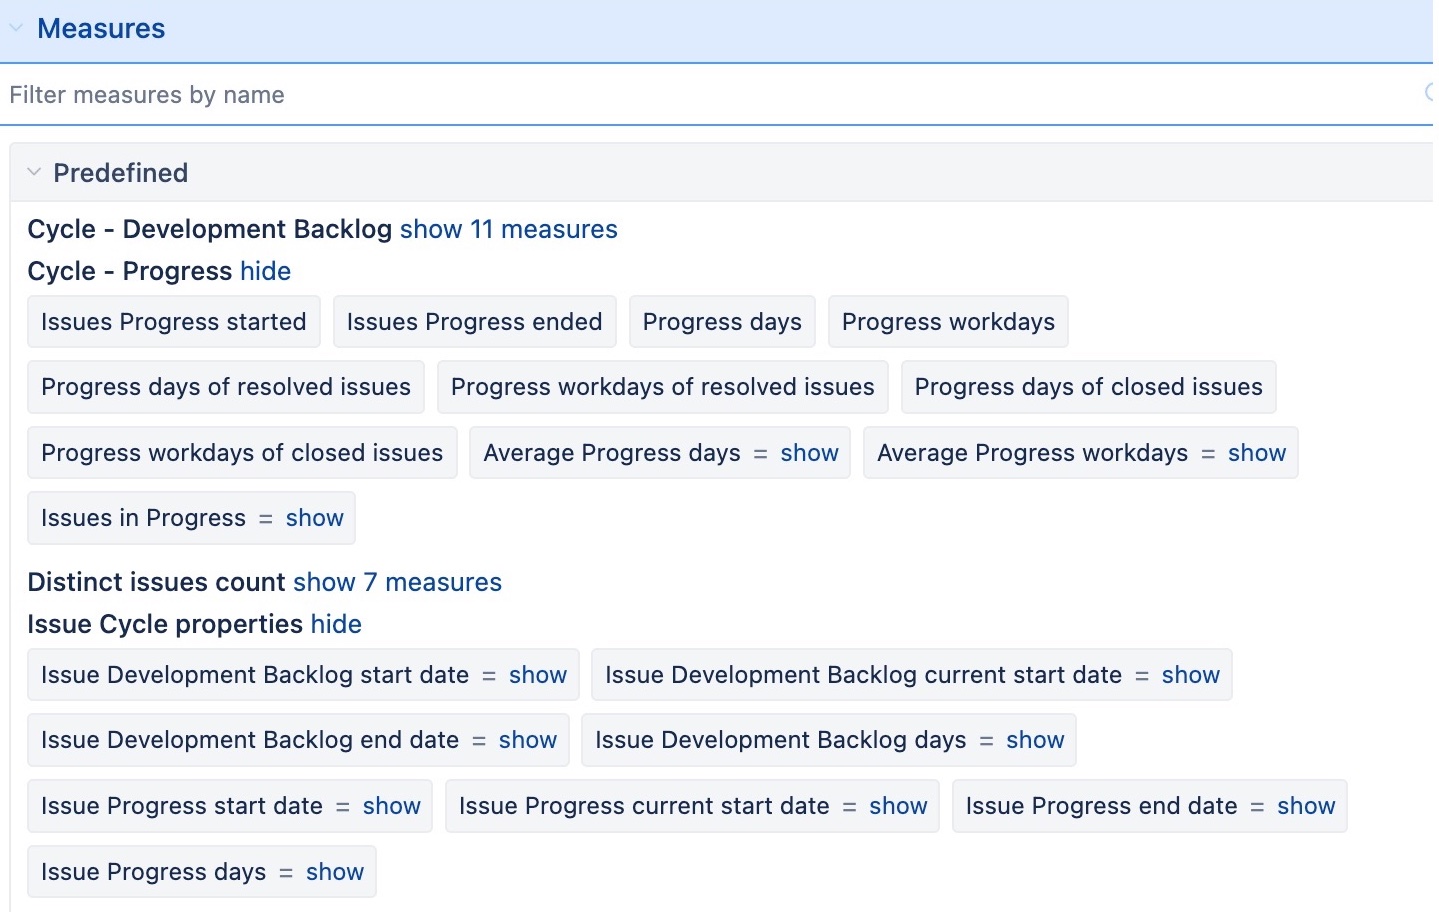
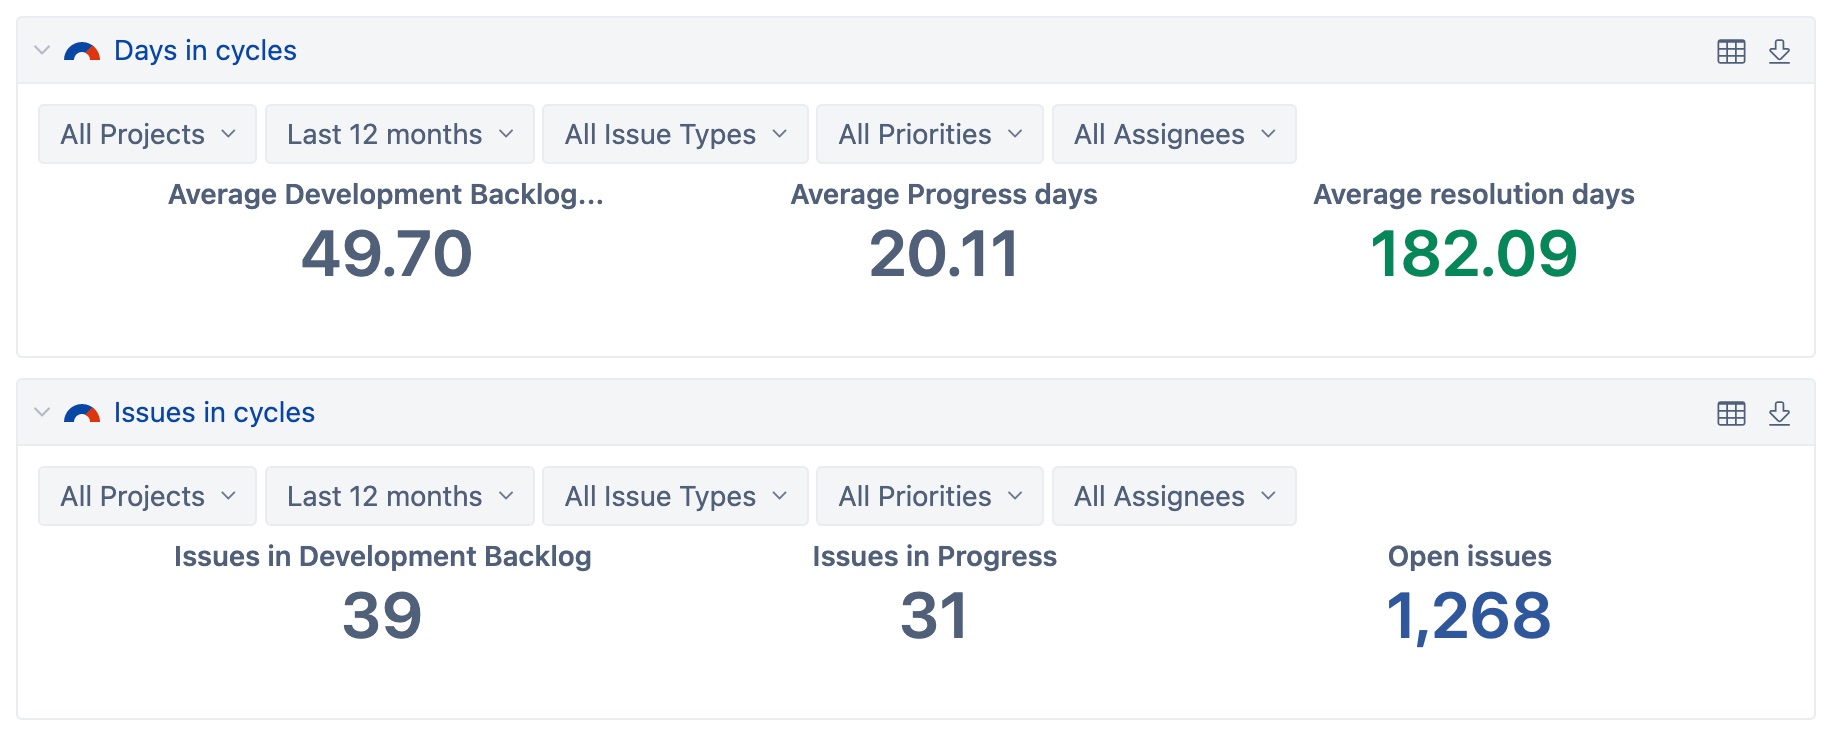
We have already seen how often defined issue cycles simplify analysis. So we encourage you to try them out! Some cycle sample reports are available out of the box to get you started.
DevOps Metrics From Jenkins
When we initially released DevOps metrics, we promised that there would be more. eazyBI integration with Jenkins was one of the most awaited from the DevOps community; finally, it is here!
You only need to configure Jenkins data import. Next, you will get the DevOps metrics described in an earlier post Analyze DevOps Metrics With eazyBI.
Tempo Integration Improvements
The Tempo apps have many resource planning and tracking options. Combined with eazyBI reports, it gives you ample options to track your plan execution. You can read more about this in the designated blog post Custom Tempo Reports in Jira Using eazyBI.
Taking it a step further, we are adding the option to import the Tempo required or available hours in this version. eazyBI imports the workload defined by the workload schemas for each user to analyze the users' capacity vs. planned or logged hours.
There are also new Tempo data-enhanced sample reports in the "Sample reports for time tracking" folder. Find and use reports for planned vs. spent or required hours over time, versions, and teams.

More Power to Custom Data Mapping
One of the most powerful eazyBI features is merging data from multiple sources. Custom source data mapping allows you to create new data cubes or import extra data to the Jira issues cube.
We have made some significant enhancements to this operation:
- if you do not have a count measure, you can now add it with one click
- you can clone a column to import it both as a dimension and a property
- create a new source data column with new content based on values in the originating data source columns
When ready to try out the simplified custom data mapping, read more about the new features on the eazyBI documentation page.
News in Measures and Custom Calculations
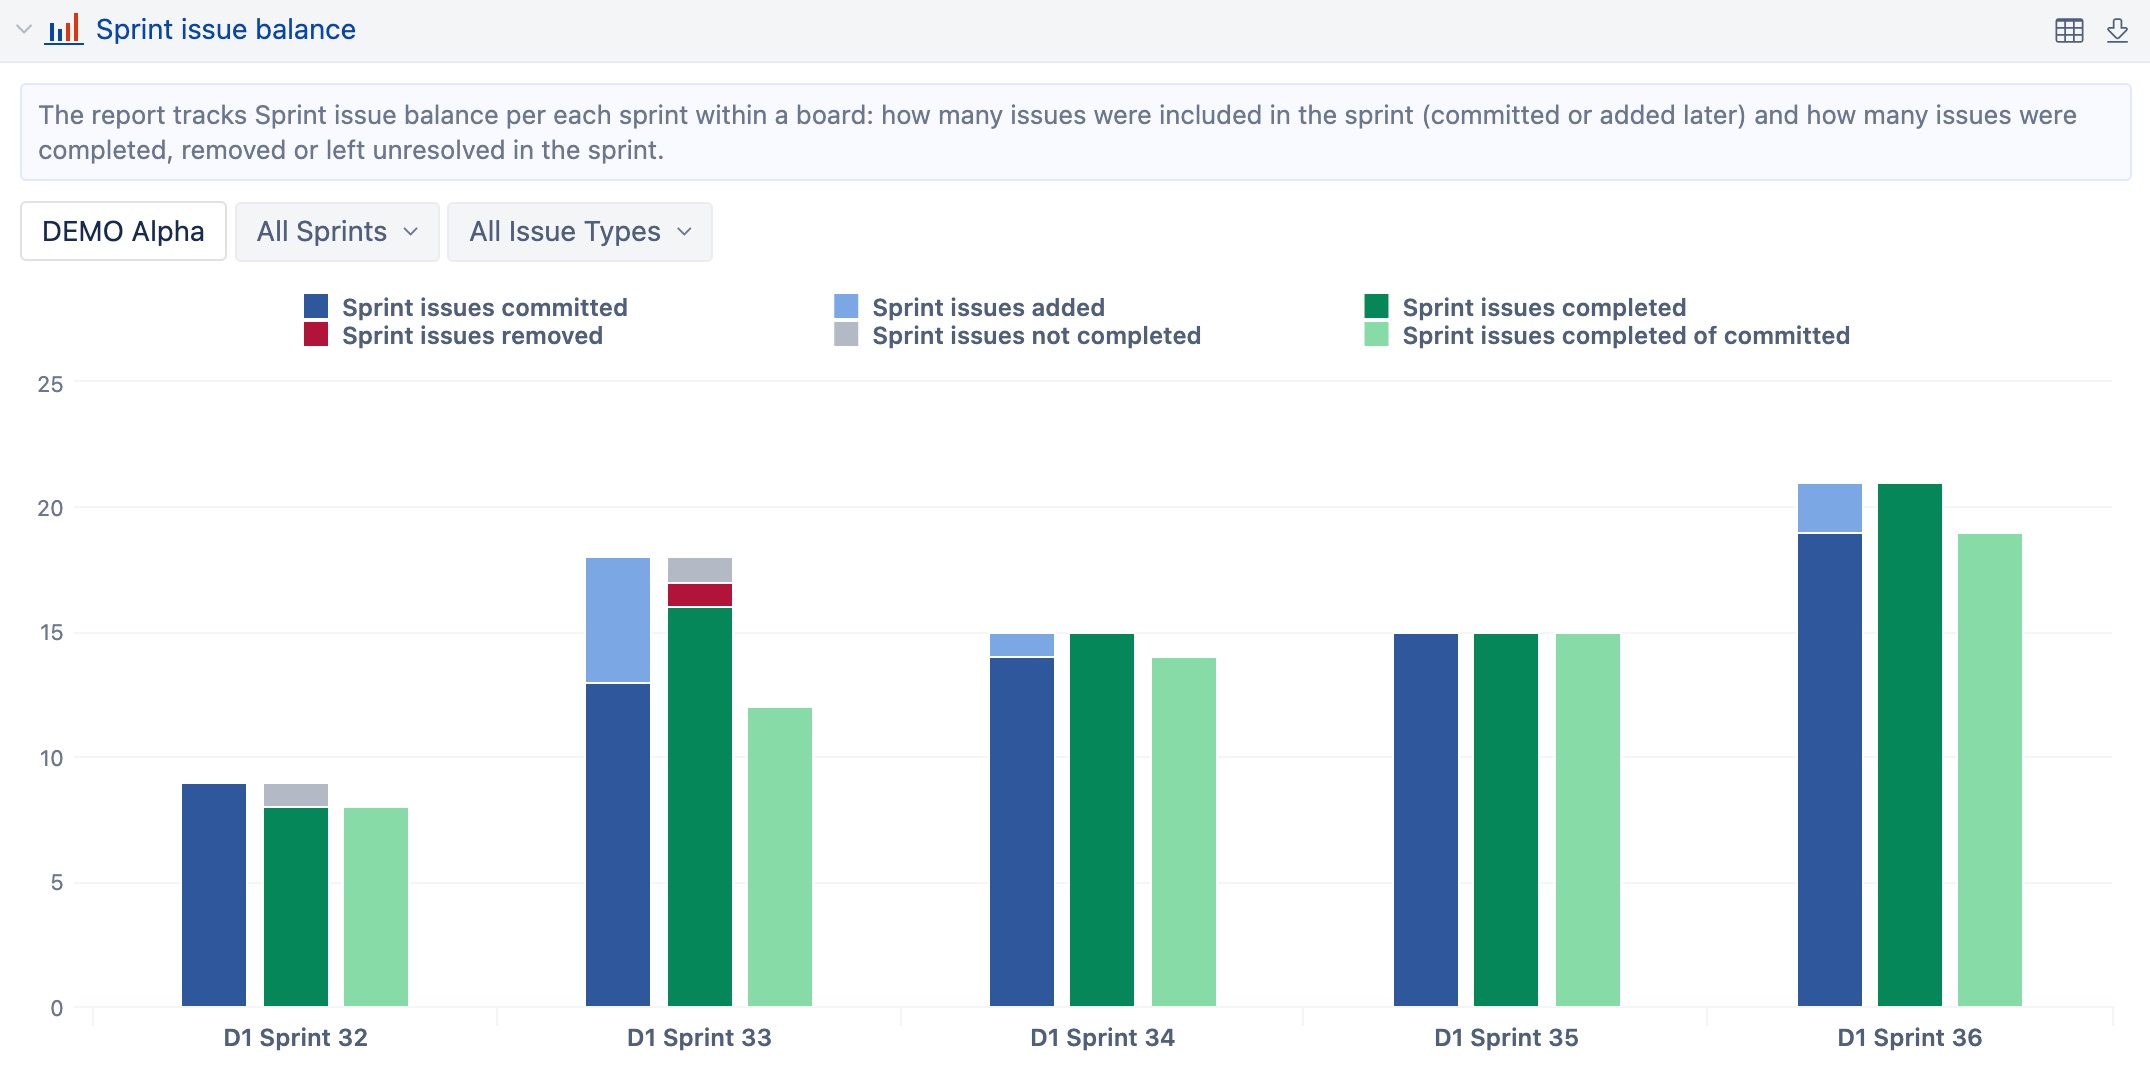
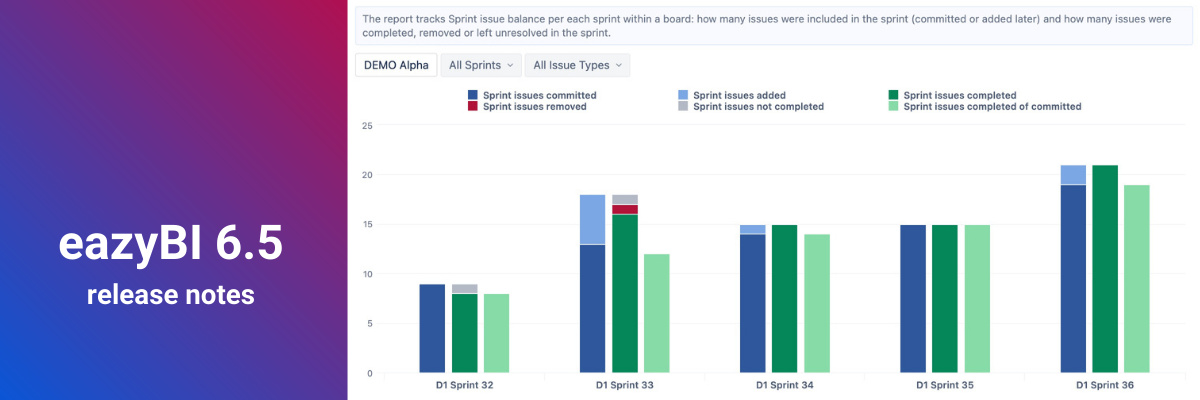
If you follow Agile and use Jira Software to track Sprints and commitments, you will most likely analyze Sprint scope changes. While all this is possible in eazyBI, a popular metric called for complex MDX calculation: how many of the committed story points were completed during the sprint.
We hear you! We have added a background calculation for Sprint Story Points completed of committed to get story point and issue count measure out of the box. Additionally, a predefined measure calculates Sprint Story Points committed completion %.
Also, new MDX functions make your calculations simpler and faster. You can read more about them in the eazyBI documentation. Here is a short sneak peek:
- DateDiffWorkHours - get the duration between two dates not only as workdays but also as work hours between two date-time fields!
- PreviousRowValue will be helpful if you need to get a value from one row "above". For example, determine how long it took between resolving the previous issue and creating this one.
- CumulativeSum function is already used in Standard calculations, and you can use it in custom measures. The function will be a good performance improvement if you wish to add the current row value to the sum of all previous values.
Time Dimension Improvements
By default, eazyBI is adding members to the Time dimension only if there is some activity in Jira on that date. Thus, future dates are added if there are planned dates in Jira (Due date, Sprint end date).
This can be limiting if you wish to analyze future projections in the report. Therefore we added an option to specify the date range in the Time dimension import options and import all missing dates within the range. During each import, eazyBI will check the dates in the range and fill the Time gaps in the specified period.
Additionally, there is good news about the Time dimension for those analyzing Insight data in eazyBI. Now you can set the time zone also for the Insight cube Time dimension.
Page Selection in Analyze Tab and Dashboards
In the eazyBI report builder, you use Rows for splitting the data while Pages - for filtering. For rows, you could already turn on the nonempty option to show only rows having actual values. In the Page area, you always got complete lists of dimension members, which was sometimes confusing. For example, if you have Projects and Issue Type dimensions on pages, you wish to see only issue types for the selected Project. This is what the new NonEmpty option in pages offers! You can now select a value in the left dimension, e.g., Project, and the values in the dimensions to the right, e.g., Issue Type, will display only relevant members.
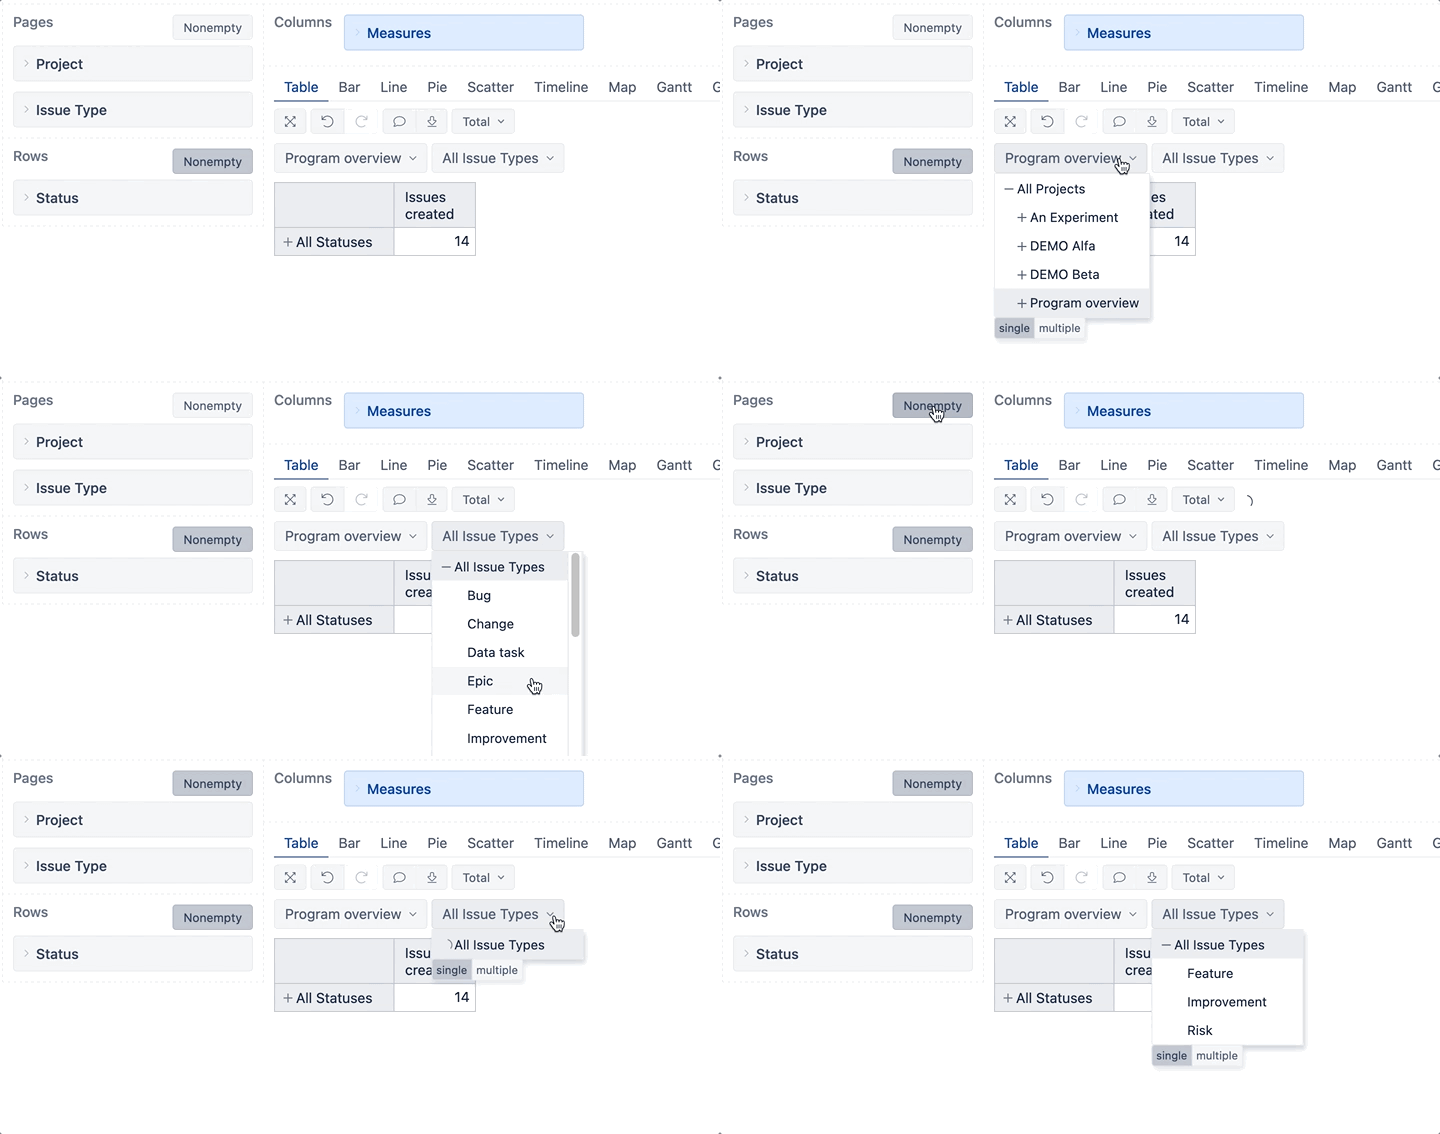
This option is also added in the eazyBI dashboard for the common dashboard pages. You can also hide common page dimensions from reports for a cleaner dashboard look.
Performance Improvements and More
And yes, there are a lot of performance improvements in the eazyBI background. For example, we have modified how reports with many page dimensions and multiple page member selections get results. Also, we have improved formulas of the Standard calculations that you can add to the reports. All this will make your reports load significantly faster.
There are improvements for the data import as well. While many changes are in the background, you might notice that now eazyBI skips an issue if it has some issue-level data problems. You will get a warning for the data that needs fixing, but the import will continue with other issues.
Another performance enhancement can be utilized by users upfront. It is now possible to publish eazyBI reports in a collapsed format in eazyBI dashboards and Jira dashboard items. Collapsed report loads result once user expands it. Go ahead and reconsider if there are reports that do not need to be loaded every time users access the dashboard. Maybe you wish them to be accessible, but only for later?
And finally, eazyBI is now compatible with Jira 9.0.
Learn all about the eazyBI 6.5 in the change log.
