
Jira Project Reporting Academy
The Jira Project Reporting Academy has begun. Learn how to build dashboards of project reports in Jira using the integration between eazyBI and Profields to centralize your project data and visualize it.
The Jira Project Reporting Academy is a free training course provided by our partner DEISER – an Atlassian Platinum Solution Partner and a Top vendor on Atlassian Marketplace.
Course instructor – Fabio Genovese
Setting up the Flow of Data from Profields to eazyBI
In this article you'll learn how to set Profields as a source for project and cross-project information in eazyBI. But there’s more you can learn throughout the free Academy course:
- How to combine issue-level information with project-level information.
- How to create powerful and memorable visualizations.
- How to build reports that help you track your project portfolio.
In this first lesson we'll explain how to create the first report on eazyBI with data from Profields. Every article is designed as a step-by-step guide.
By enrolling to the Academy, you'll additionally receive a DIY Checklist to help you create your own set of project reports, independently of my particular choices, as well as access the full Jira Project Reporting Academy Course for free.
During the course I'll show how to create different graphs and grids to represent Jira+Profields data and combine them into a dashboard that helps you with project planning and decision-making.
Here's the full syllabus:
- Keeping your budget under control.
- Combining different project variables in one chart.
- Creating gantt chart views of your project portfolio.
- Entering different charts in a project Dashboard.

What If You're a Newbie?
You can start by discovering how to leverage the Atlassian marketplace to transform Jira into a project tracker. Independently of whether you are a project manager, a product manager, or any other type of role with Jira projects, you should know that Profields will help you centralize and manage your project level data.
For example, you can store important information about your projects, including:
- Budget.
- Start Date/End Date.
- Time spent.
- Team members. … or any additional information required at project level we need.
The immediate win is to have that information displayed in the Project Navigator.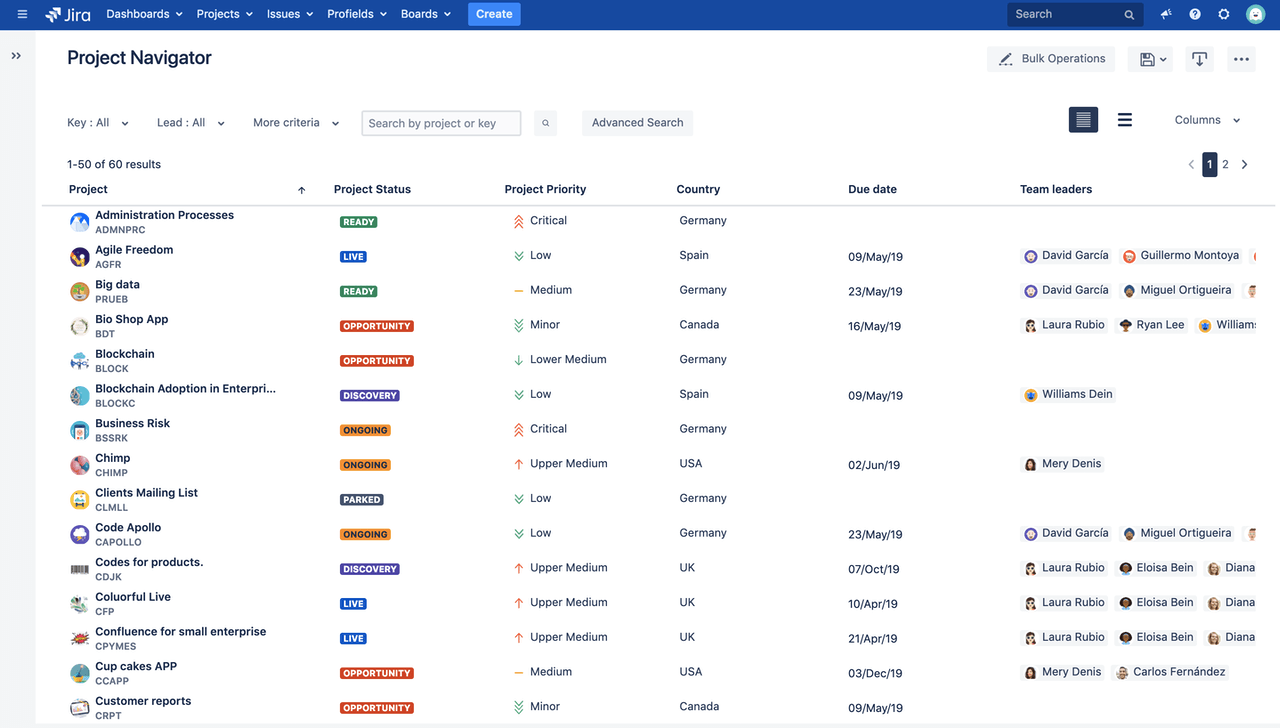
With Good Data Comes Good Reporting
Having information that is accurate and permanently updated is important, but probably not and end in and of itself. The real need is… reporting.
Put succinctly, one of the main needs of a project manager is:
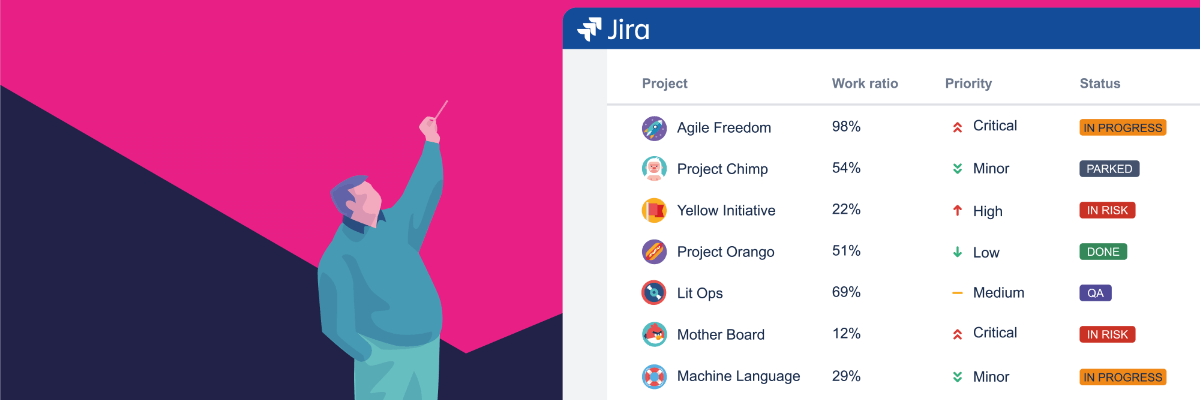
To Have Reports That Can Be Used to Keep Projects Under Control
It's so easy to miss something important in a project when you're not the only person running it! Additionally, your boss will likely want to see objective data about the project that explains how the project is doing and whether it will be successful.
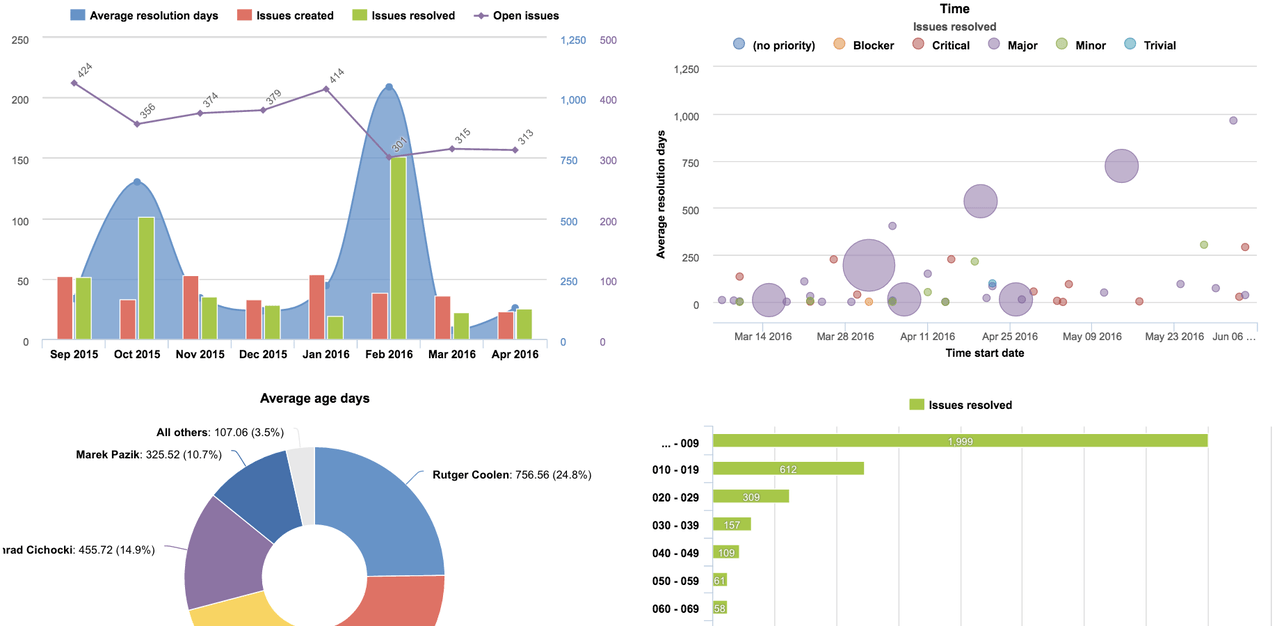
That's why having a dashboard like this is the dream for every project manager: with it, anyone can see the evolution of a project at a glance and take corrective actions when needed.
Why eazyBI?
There's a bunch of reporting apps in the Atlassian marketplace, but eazyBI is the must-have tool for Business Intelligence: it's flexible, versatile, and sophisticated.
If you ever get lost with eazyBI (particularly if you don't follow my exact steps because you want to implement different metrics), feel free to browse eazyBI's amazing documentation. Here's the article on the main terms and concepts.
Combining eazyBI with Profields, project managers are allowed to:
- Read information from Jira and use it for Business Intelligence.
- Leverage Profields' data to create reports at project and cross-project level.
- Enjoy the visual cues of different kinds of charts.
- Combine multiple dimensions in one chart to create new insights and compare.
Ok, let's get started with what's probably the most important dimension for controlling projects:
Keep Your Budget Under Control
If you have a project for a client, probably the first thing you're looking at is the budget line… and how you're going to spend it. In this section we'll see all the steps required to configure a project with all required data so that we can then configure eazyBI to show the results!
We start by defining the following Profields fields:
- Estimated Budget.
- Cost per hour.
Below you can see the field page of Profields with those two fields.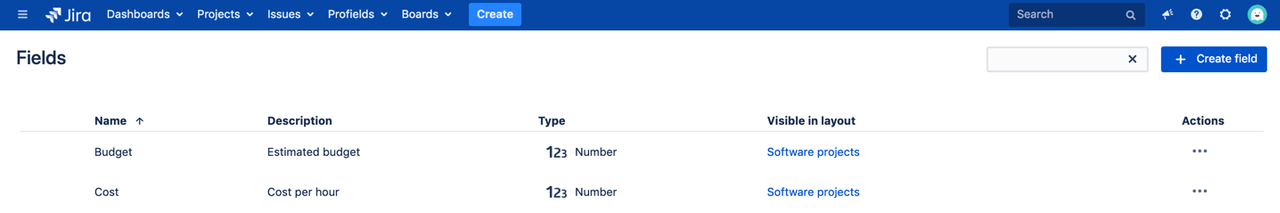
Next, we create a project Layout with both fields. This layout is already associated with my projects.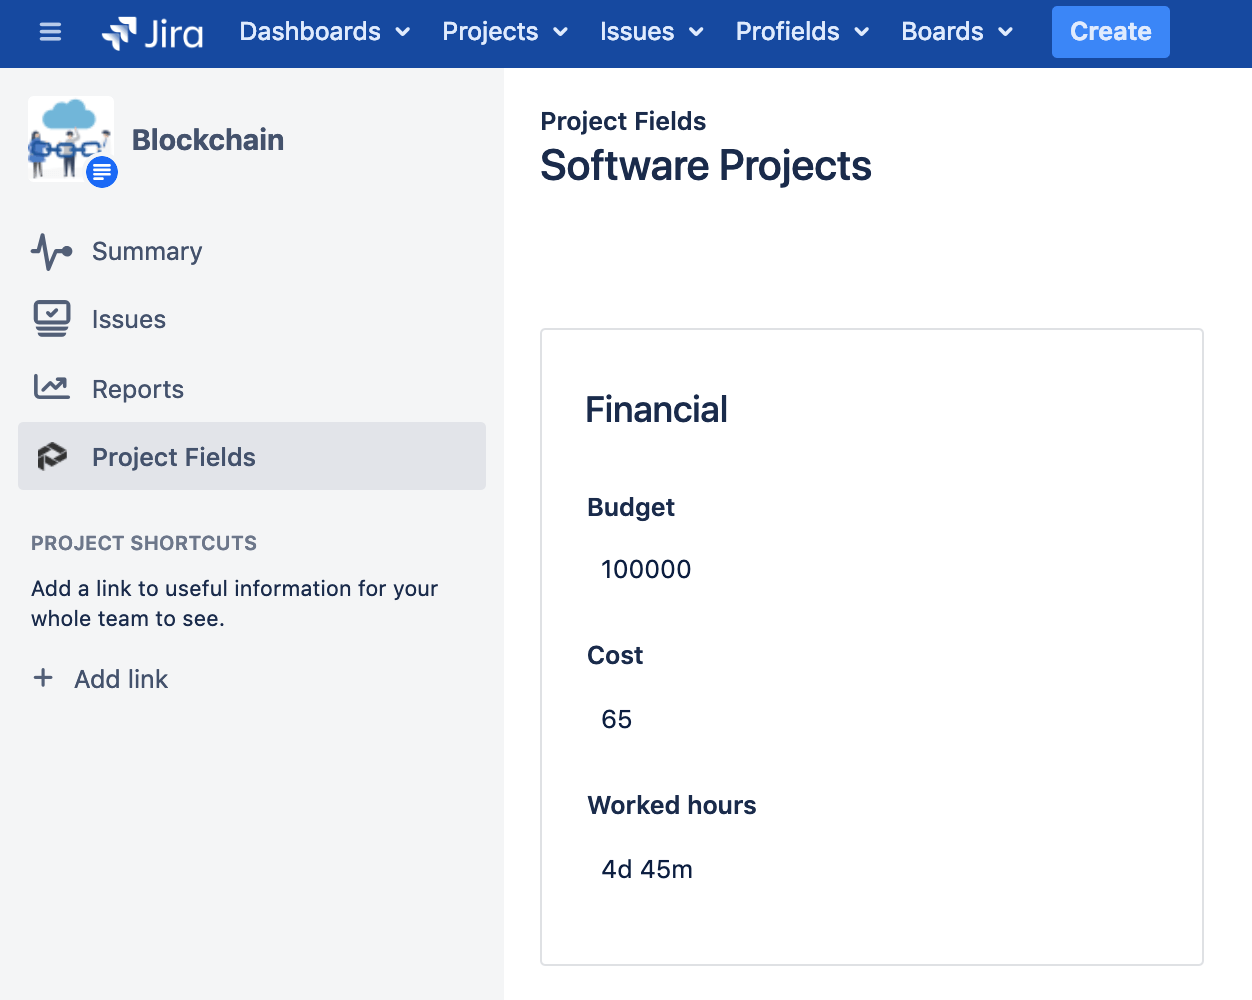 Now let's switch to eazyBI and define how we want to import data and define which Profields fields we want to manage in eazyBI.
Since Profields is already integrated with eazyBI, you can simply go to the apps tab in the Jira import options.
First we'll set the two Profields fields to be imported both as measure and property. You can check the documentation here for other available options.
After the import, we'll define our report with the measures eazyBI makes available.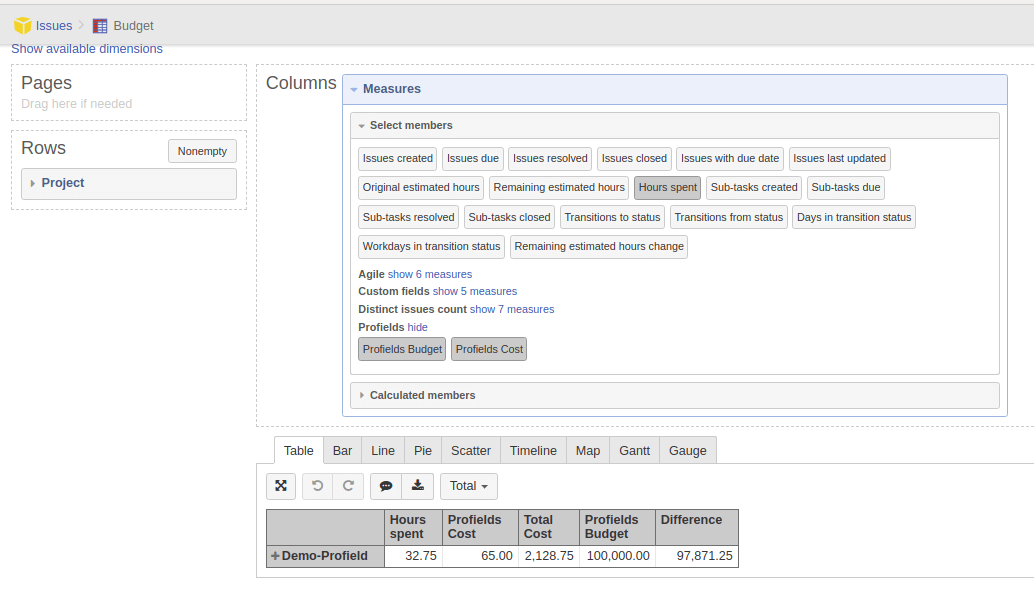 …and include all this information:
- Total hours spent.
- Cost per hour.
- Total cost spent.
- Total Budget.
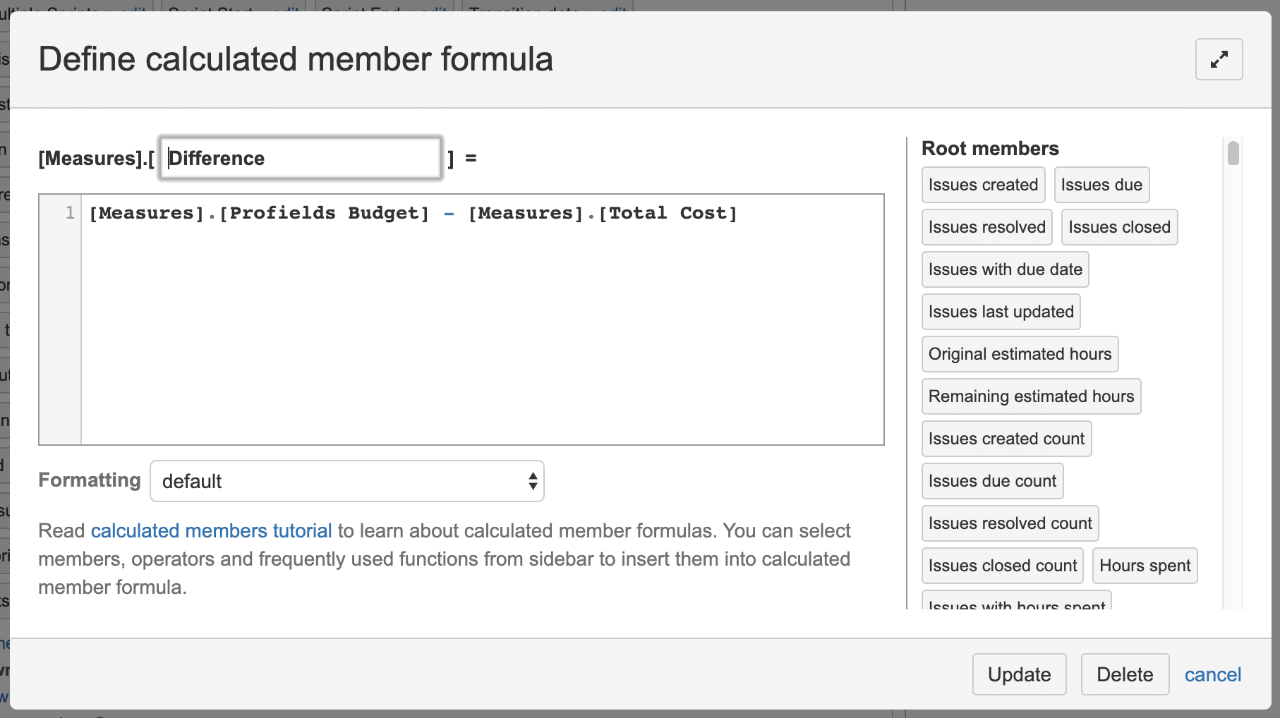
- Difference: aka Usable budget. This is a calculated measure. Use the code in the following image to define it.
Add Reports to Jira Dashboards
Finally, you can add the eazyBI report or dashboard gadget to your Jira dashboard, where you can immediately see how the project is progressing.
Next Steps
This is the first step of this journey. Join the Jira Project Reporting Academy for free to receive a DIY Checklist to help you create your own set of project reports, independently of my particular choices, as well as access all additional courses.
- Keeping your budget under control.
- Combining different project variables in one chart.
- Creating gantt chart views of your project portfolio.
- Entering different charts in a project Dashboard.
About the author

Fabio Genovese aka Artigiano del Software is passionate for History, Medieval and old school fencing, and Computer Science. He has been writing about Atlassian products since 2013 in his Italian blog. He’s also exploring new ways to use Atlassian products in various environments and scenarios, following his consulting experience in different customers.