
Jira Sprint Reports: How to Create Agile Reports in Jira
Sprint reports are an essential part of any development process. You can identify areas where they need to focus more attention, track progress, identify issues early on, and make quick decisions based on the data. Jira sprint reports are a great way to keep everyone on track and ensure that you complete projects on time.
Jira sprint reports typically come up in review meetings — progress checks and retrospectives. For the former, they help identify challenges that get in the way of achieving set goals. Team members can see where there are lags and address them while the sprint is still ongoing. Regarding retrospective meetings, sprint reports contribute insight that can help improve a team’s approach to subsequent projects.
What Are Jira Sprint Reports?
Jira sprint reports visually represent issues within a sprint (a fixed time period in which teams tackle a set amount of work). To break this down further, issues are pieces of work that undergo workflows until the completion of the full scope of work. Each issue can have subtasks, and each subtask can be assigned to different team members. As time goes by, teams can track parent issues and the subtasks under them for assessment purposes.
With this in mind, it’s important to note that Jira sprint reports only apply to Scrum boards.
Why Do You Need Jira Sprint Reports?
Now that we know how sprint reports work, the next thing to address is the importance of sprint reports for Agile teams.
Enhanced Project Ownership

Jira sprint reports are a significant part of teamwide project ownership and collaboration among individual contributors. They foster collective success by showing how each team member’s work fits into the larger vision.
Better Management of Responsibilities
 Sprint charts help teams develop an overview of everyone’s role by indicating issues that require attention. Tasks are assigned with regard to each team member’s area of expertise. As a result, there’s clarity on individual responsibilities to get tasks done in the early stages of a given project.
Improved Workflows and Processes
 Jira sprint reports typically come up in review meetings, be they progress checks or retrospectives. For the former, they help identify challenges that get in the way of achieving set goals. Team members can see where there are lags and address them while the sprint is still ongoing. Regarding retrospective meetings, sprint reports contribute insight that can help improve a team’s approach to subsequent projects.
Types of Jira Reports for Sprint Analysis
There are many types of Jira reports for sprint analysis. Reports can include issues, tasks, defects, risks, and issues with dependencies. Let's review some of the most popular Jira sprint report types:
Sprint Burndown Charts
To measure the success of a sprint, it is important to track the progress made. A sprint burndown report is a great way to do this.
A sprint burndown chart illustrates all the tasks completed during the sprint and how much time was spent on each one. This information allows team members to see where their time was spent and whether or not they are on track to complete their assigned tasks.
Sprint burndown charts are characterized by a slope that declines over the sprint’s duration (x-axis) with story points on the vertical (y-axis).
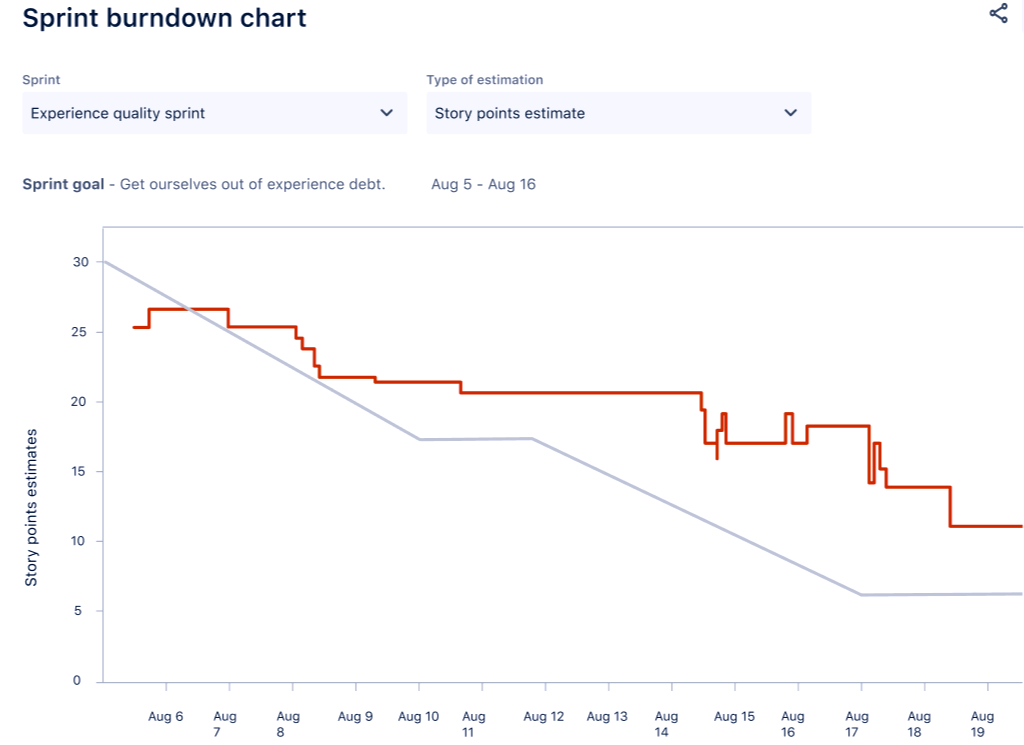
By tracking the progress made daily, teams can ensure that they are making maximum use of their time and are moving forward towards their burndown goals.
Sprint Velocity Reports
The sprint velocity chart displays the average amount of work a scrum team completes during a sprint. It comes in handy when deciding how much time to allocate for work in the future based on past indicators of work completed over multiple sprints. Generally, more sprints offer better forecasts, as there’s more data to go by.
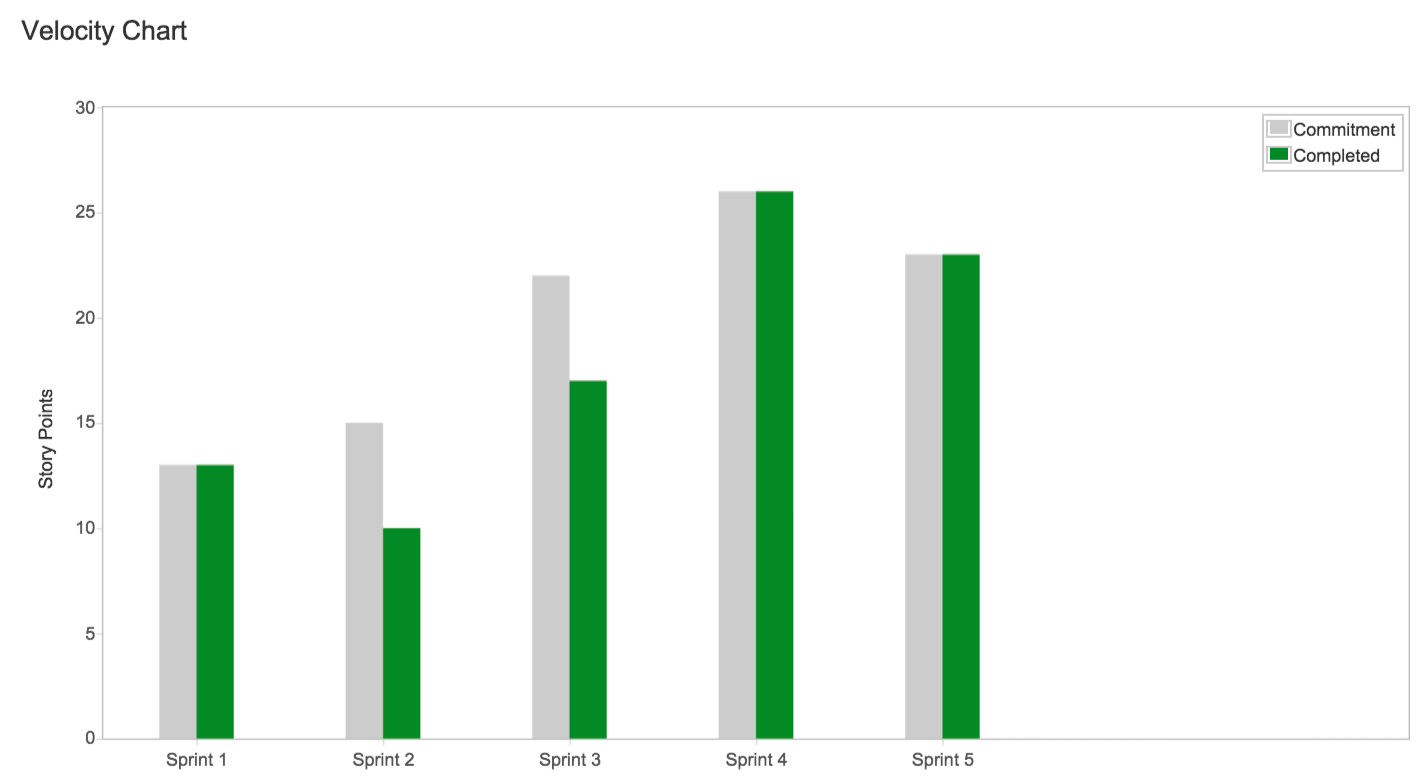
Sprint velocity charts are easy to read and understand. Each pair of gray and green bars on the x-axis represent previous sprints completed by the team. The gray bar shows committed story points in the sprint when it begins. The green bar shows the total completed story point when the sprint ends. Any changes made after the sprint has started will not be added to the gray “Story points committed” column but will be included in the green “Story points completed” column.
Sprint Control Charts
A Control Chart helps you identify whether data from the current sprint can be used to determine future performance. The less variance in the cycle time of an issue, the higher the confidence in using the mean (or median) as an indication of future performance.
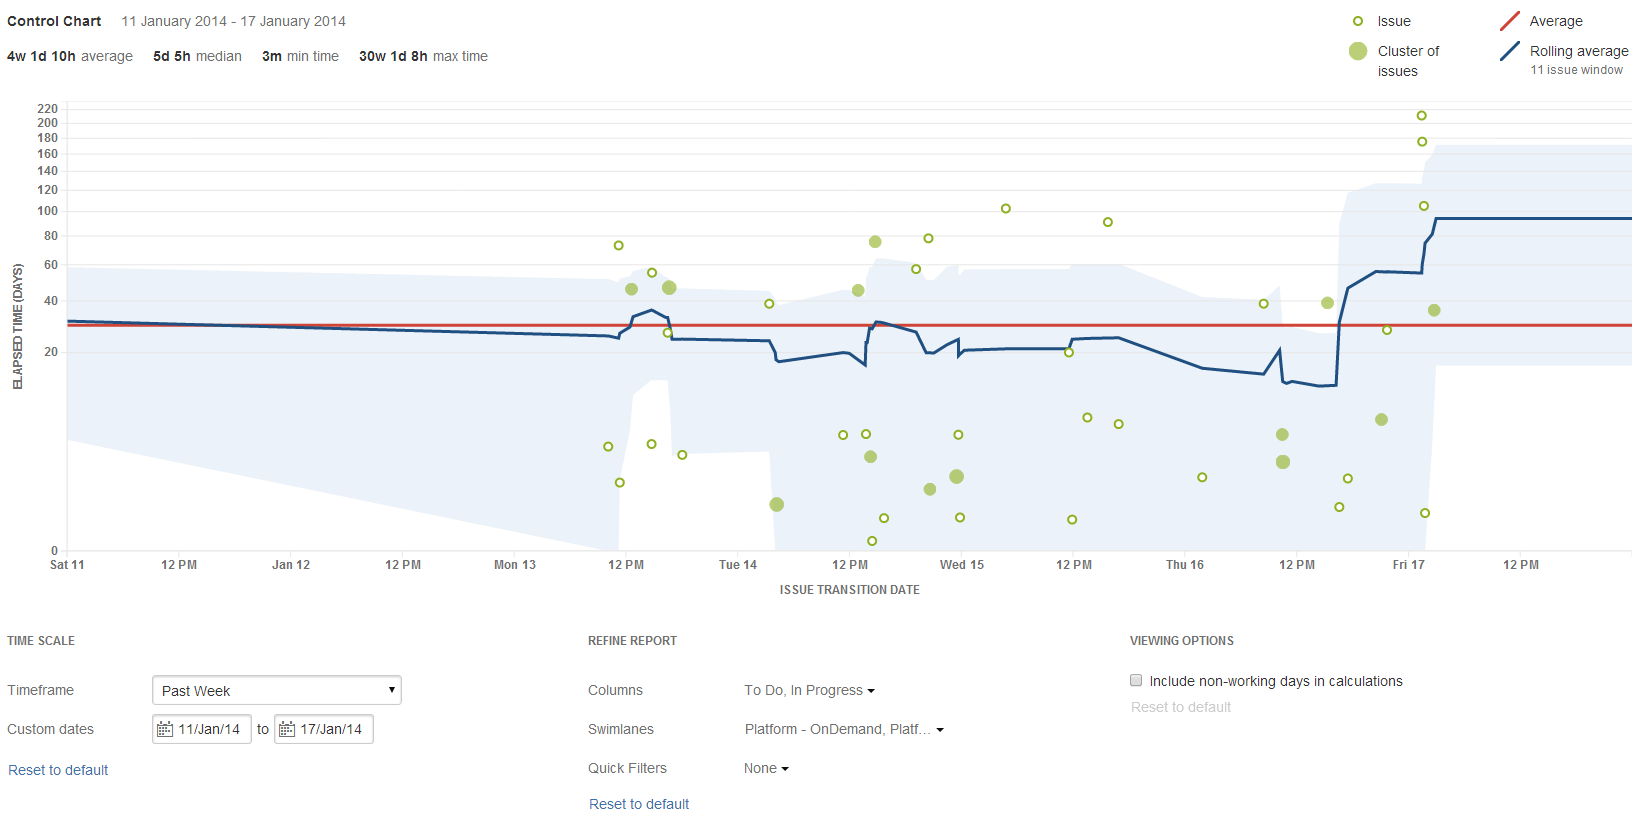
The Control Chart shows the Cycle Time (or the Lead Time) for your product, version, or sprint. It takes the time spent by each issue in a particular status (or statuses), and maps it over a specified period of time. For each date the chart shows the average (red line), rolling average (blue line), and standard deviation (the grey area).
Cumulative Flow Diagram
The cumulative flow diagram shows the statuses of issues over time in an area chart. This helps you identify potential bottlenecks that need to be investigated. The bottlenecks are can be spotted if the area in the flow diagram starts to widen over time.
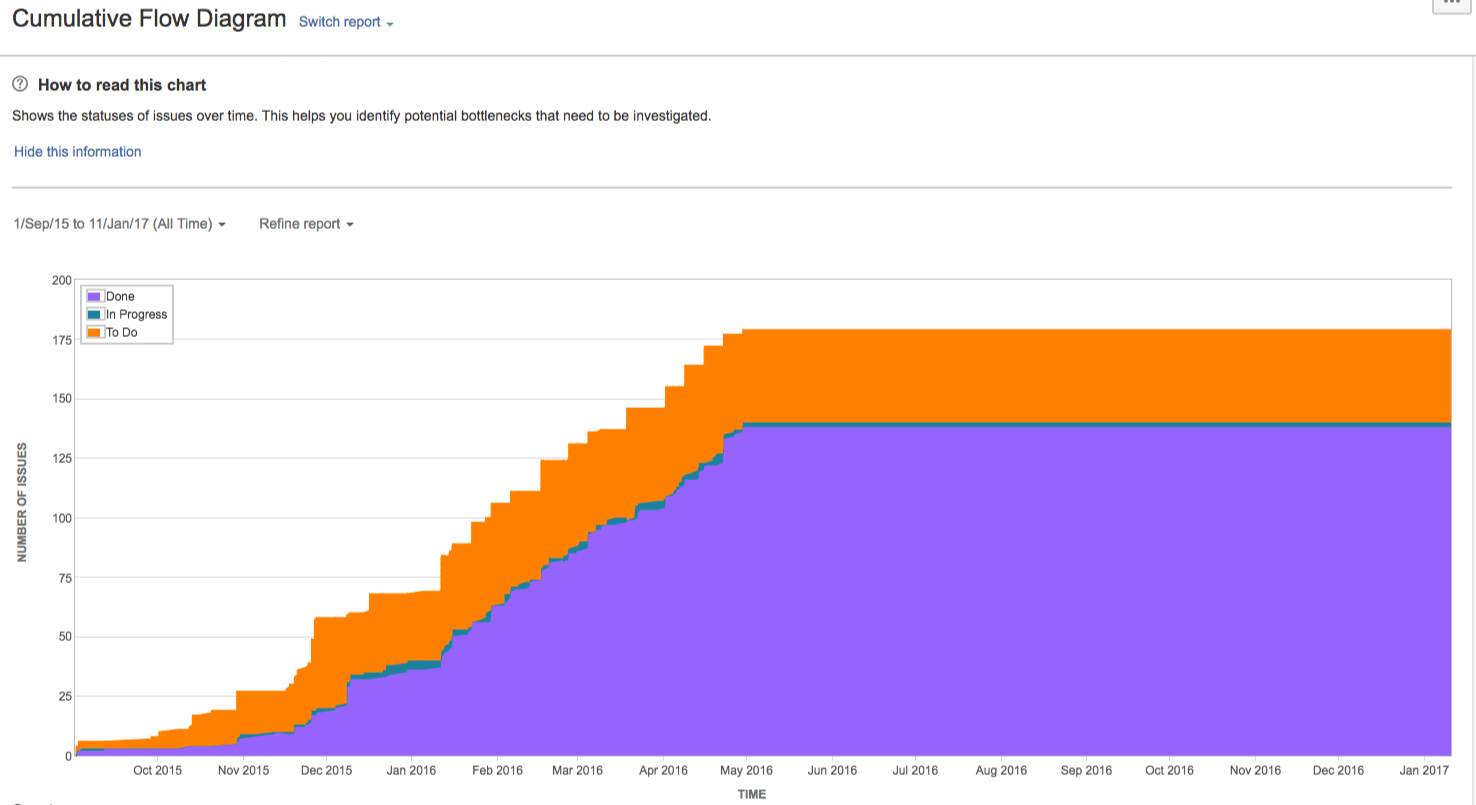
The horizontal x-axis in a cumulative flow diagram indicates time, and the vertical y-axis indicates issues. Each colored area of the chart equates to a workflow status.
How to create sprint reports in Jira
First, remember that sprint reports are specific to boards and will, therefore, only capture issues as defined by the saved filters in use within a given board.
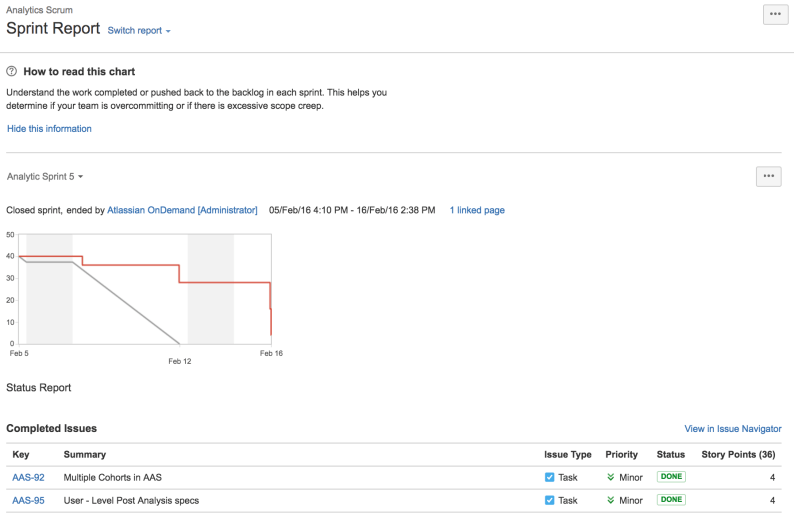
Sprint reports are inherently two-dimensional graphs. The vertical (y) axis will display story points. Think of these as subjective units of measurement showing the effort needed to complete a task compared to other tasks in the sprint. You can choose to view hours rather than story points if you like.
On the other hand, the horizontal(x) axis indicates the time in days, weeks, or months.
Issues can either be marked as “Done” or “To Do.” For an issue to be considered still in progress, it will be mapped to the leftmost board column. To be considered done, it will be mapped to the column on the farthest right side of the board.
Now, to create a sprint report:
- Go to the board you want to analyze;
- Click on Reports, and select Sprint Report;
- Select the required sprint from the sprint drop-down.
Limitations of Jira Reports and Dashboards
Jira provides a set of built-in customizable reports to give you an overview of your work. Having some of these standard reports at your fingertips is convenient. If you’ve tried to use Jira reports, you probably already know that the built-in report configuration and customization options are very limited. Essentially you can only change or select one board, choose the time period, and select or unselect certain issue statuses or issue types depending on a chart. This leaves something to be desired.
What if you need more?
- More report customization;
- Ability to change colors or labels;
- Change a chart type;
- Compare time periods or sprint side by side;
- Analyze team or user workloads;
- Calculate average velocity over all projects and teams;
- Share your reports outside Jira and Confluence;
- Filter report and dashboard data on the fly;
- Or add your own calculations...
This is where Jira reporting apps like eazyBI came in.
Advanced Sprint Reports With eazyBI
eazyBI for Jira removes all reporting limits and enables you to analyze any data that Jira can provide. It brings new dimensions, metrics, charts, calculations, and unlimited customization options for Jira analysis and beyond. And all that within Jira, without needing any other external tools.
eazyBI is an extremely flexible and useful app. It certainly takes your Jira reporting to an advanced level. Anything from lowest details to a high profile interactive executive dashboards can be built seamlessly. On top of this, you will be able to perform any calculations and derive any insights not only from literally every Jira field, but also combine and map them to multiple sources of data. Their support is top-notch!
~ Alex Surkov, Deloitte
Sprint Story Point Balance
With the sprint story point balance report you can have an overview of the overall "discipline" within a sprint. Some of the details you can capture include:
- Sprint Story Points committed. This displays the total story points from issues assigned in the selected sprint when it was started. Story points are counted from issues, whether or not they were completed at the start of the sprint.
- Sprint Story Points added, and Sprint Story Points removed. These measures indicate that the sprint's scope was changed after the sprint started.
- Sprint Story Points change. This measure indicates the changes in story points after they were added to a sprint when it was already active.
- Sprint Story Points completed. This measure indicates all the story points completed when the sprint was closed. Completed issues are those whose status is marked as done.
- Sprint Story Points not completed. This measure shows the total story points that were not yet completed when the sprint ended.
- Sprint Story Points commitment changes indicate the change in story point commitment. If commitments often change during the sprint, you should look for a cause.
Story Point Burn-Down Chart
Track the total work remaining and predict the likelihood of achieving the sprint goal based on your current velocity. The report shows the current trend, optimal burndown guideline, and resolved and remaining story points per selected sprint.
Sprint Issue Burn-Down Chart
Sometimes, instead of using Story Points, you might use the number of issues to evaluate the sprint progress. The sprint issue burn-down chart tracks the total work completed and remaining in a particular sprint.
Sprint Time Tracking With Remaining Estimate
The sprint time tracking estimate report is based on hours spent and remaining estimated hours. This gives an overview of the initial estimation at the beginning of the sprint and changes over time when logging hours or when estimates are updated.
In the chart:
- Sprint Remaining Estimates committed: Remaining estimated hours for issues committed to a sprint when it was started.
- Sprint Remaining Estimates added: Remaining estimated hours for issues moved to a sprint while it was active.
- Sprint Remaining Estimates change: Remaining estimated hours changed for issues in a sprint while it was active.
- Sprint Remaining Estimates removed: Remaining estimated hours for issues removed from a sprint when it was active.
- Sprint Remaining Estimates at closing: Remaining estimated hours at the moment when a sprint was closed; how much work is not completed during a sprint.
Sprint velocity chart
With a sprint velocity chart, you can track the amount of work committed and completed from sprint to sprint per selected project over boards. The report shows only closed sprints with committed story points. Vertical version release guidelines provide an additional reference and context to your sprint reports.
How to Build Sprint Reports With eazyBI
If you'd like to dig in and learn more about building advanced custom sprint reports with eazyBI, check out this "Sprint reports in eazyBI" webinar recording. You'll learn about:
- Building blocks in eazyBI report building
- Sprint scope metrics and reports
- Differences between Jira reports and eazyBI reports
- How to build advanced Sprint reports