
The 80/20 Rule: How to Calculate the Pareto Principle?
Time, money, supplies, energy — every business has to manage its resources efficiently. How can you reduce waste and increase your return on investment? As it turns out, there is a simple but very powerful tool that can be applied to almost any aspect of your business and life.
The universe is imbalanced. Whether it's business, life, or nature – cause-and-effect relationships are never equal. There are the vital few and the trivial many everywhere.
There is a universal law, with many names, that describes these imbalanced relationships.
- 80/20 rule, or 80-20 rule, or 80:20 rule,
- 80/20 principle, or 80-20 principle, or 80:20 principle,
- Pareto principle, Pareto's law, or Pareto theory,
- principle of imbalance,
- principle of factor sparsity,
- principle of least effort,
- rule of the vital few, or the law of the vital few.
If you know and understand this universal law, you can use it to your advantage. Apply it to see patterns, identify top and bottom performers, and make the right decisions.
Origins of the 80/20 Rule
The law of imbalance has existed since the beginning of time, but it was discovered in 1896 by Italian economist, Vilfredo Pareto.
Pareto discovered that approximately “80% of the land in Italy was owned by only 20% of the population”. He soon realized that this 80/20 rule seemed to be a universal truth that could be applied to practically all aspects of life:
- 80% of outputs are produced by 20% of inputs.
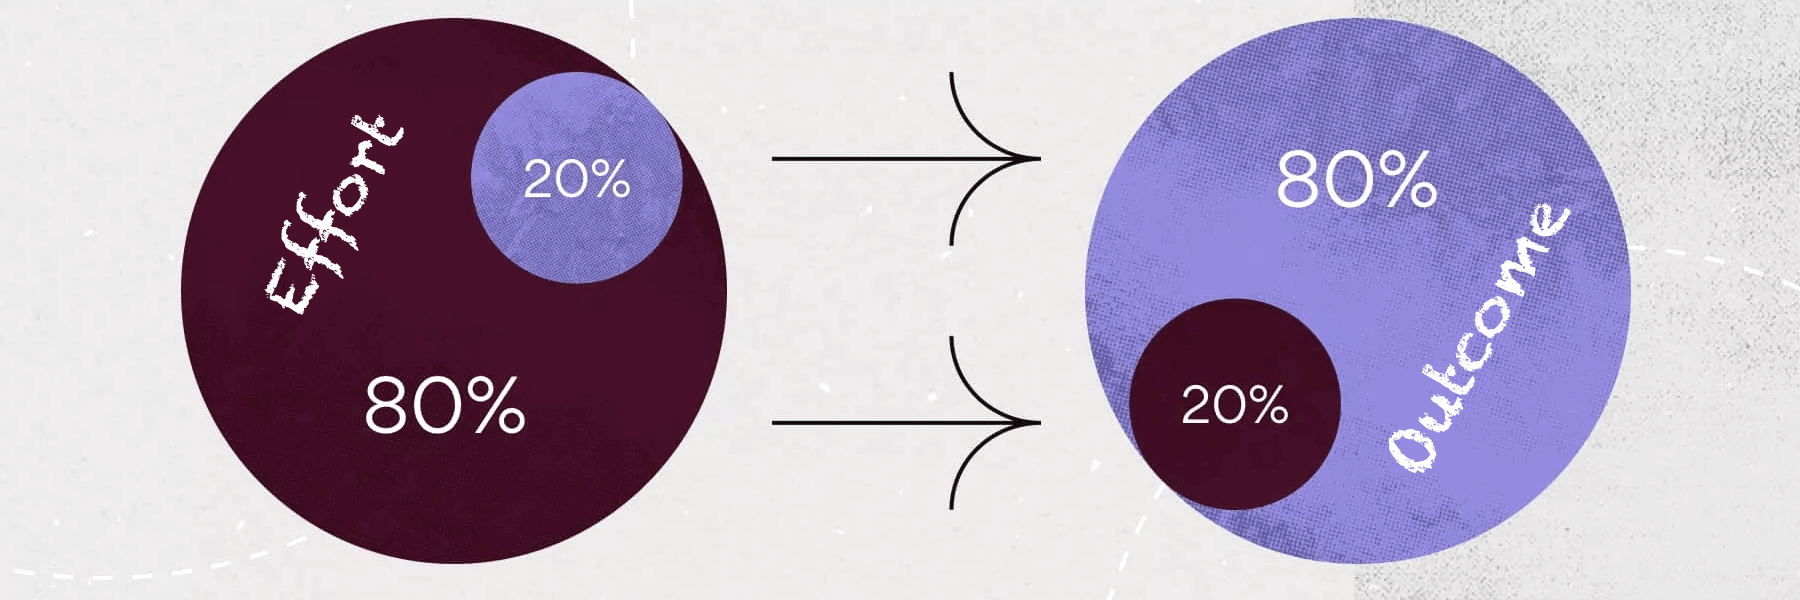
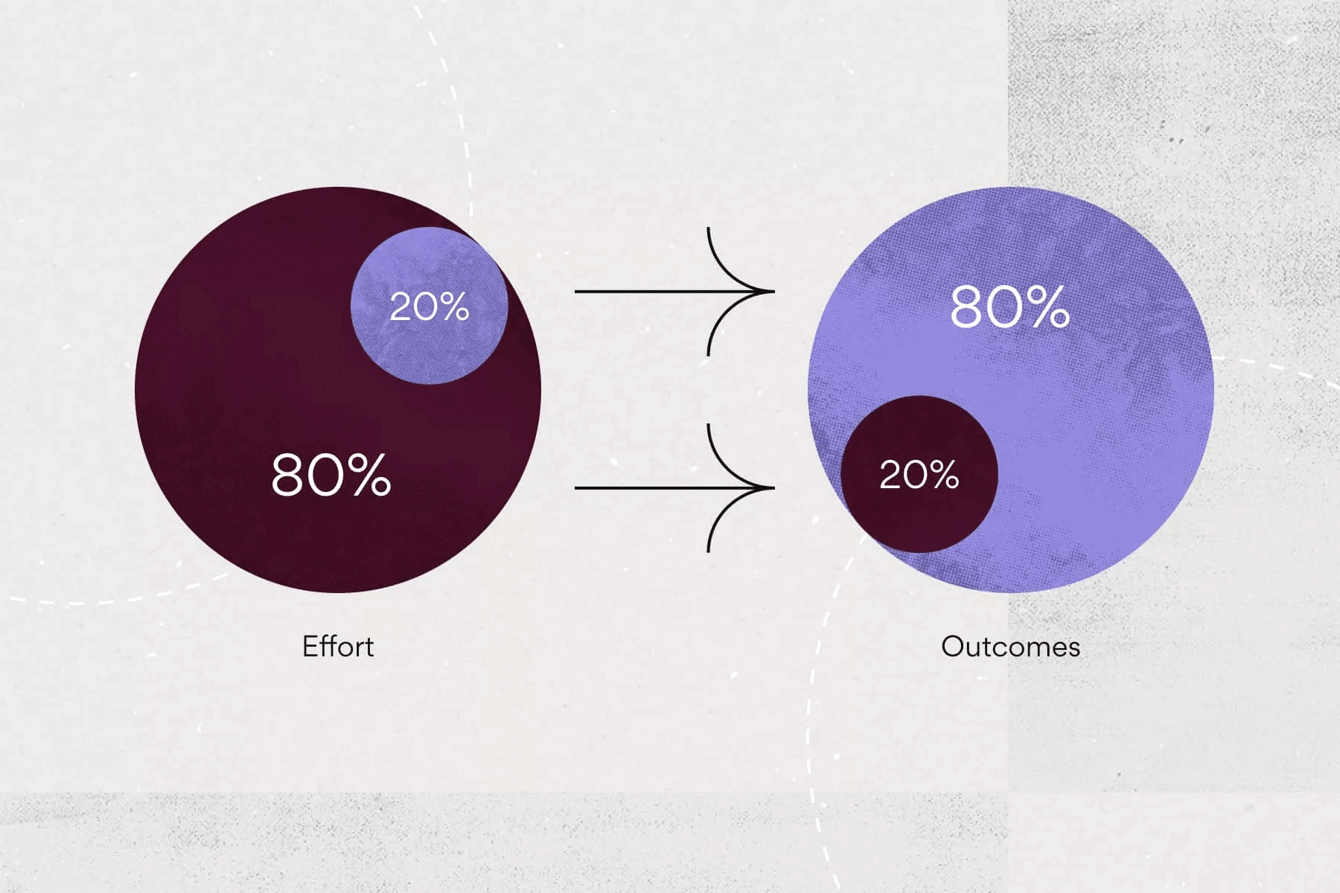
- 80% of results come from 20% of the effort.
- 80% of the work time is often spent on 20% of tasks.
- 80% of the world’s riches are concentrated in 20% of developed countries.
- 80% of sales come from 20% of customers.
- 80% of profit comes from 20% of products or services.
- 80% of warehouse stock comes from 20% of suppliers.
- 80% of the peas are harvested from 20% of the pods.
- 80% of the world’s food is grown in 20% of the world’s countries.
- 80% of criminal activities are performed by 20% of the population.
- 20% of your friends will consume 80% of the beer at a party.
- 80% of the time you visit only 20% of your friends or relatives.
- 80% of readers will read only 20% of this article.
The 80/20 Distribution
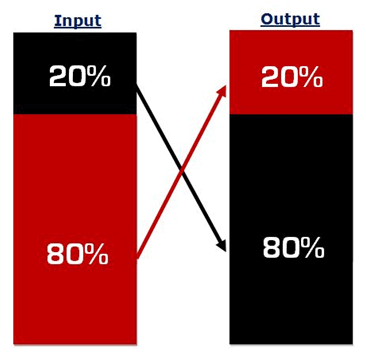 Often, the 80/20 is represented as two stacked columns to compare and contrast.
It's worth mentioning that the distribution is not always 80/20. There are even more extreme variations of the Pareto principle, like 95/5 or 99/1.
For example, in language learning, knowing just 5%—7% of the total number of words will allow you to understand anywhere from 90%—95% of the vocabulary found in common texts!
In Pay-Per-Click advertising, only 5% of search keywords bring in 95% of leads.
In the Pareto principle, the inputs and outputs do not have to add up to 100%. The relationship could as well be 80/40, 60/20, 90/30, or 100/10. The 80/20 distribution is just the most common one.
How You Can Use the 80/20 Rule?
The 80/20 rule is a simple concept that can be applied to many situations. It states that 80% of the results come from 20% of the effort. This means that you should focus on the 20% of your efforts that will lead to the greatest reward, or yield the highest value for your time and energy.
You can use this principle in any area of your life, whether it’s in business, education, relationships, or any other aspect. For example, if you want to learn a new language, focus on the 20% of words and phrases that will likely be used most often. If you’re trying to improve your physical fitness, focus on exercises that are most beneficial for reaching your goals – such as jogging or weight training.
By applying this rule in different areas of life, you’ll be able to maximize your effort and get more out of each day. If you apply the 80/20 principle to prioritize your daily tasks, you might get an 80% impact by completing only a fifth of the items on your to-do list instead of completing everything.
The Power of 80/20
The 80/20 rule is actually infinite. You could, for example, look at the top 20% and apply the 80/20 on this data subset, then on the sub-subset, and so on. It's like using a magnifying glass to discover even finer details about your business.
In an example from Perry Marshall in a primer to the Pareto principle, he writes: “If you have 1000 customers, 80% of your business comes from 200 of them. But if we now look at those 200 best ones, 80/20 is still true. 80% of business from those 200 will come from 20% of the 200, which is 40.
If you now look at the top 20% of the top 40 customers, it will leave you with 8 customers. Nearly half of your entire business will come from those 8!”
How does it work? Let's do the math. If 80% of 80% of business comes from 20% of the 20% of the customers, it's (0.80 x 0.80) / (0.20 x 0.20). This means that 64% of business comes from 4% of the customers. That is 80/20 squared or (80/20)2.
“Zoom in” and look at the top 20% of the top 20% of the top 20%, and you'll discover that nearly 50% of the business (0.80 x 0.80 x 0.80) comes from only 1% of customers (0.20 x 0.20 x 0.20). That is 80/20 to the power of 3 or (80/20)3.

If you plotted all those relationship points on a chart, you'd notice that they form a curved line. This line is often called the Pareto distribution curve.
There are many distribution curves, each describing a different relationship between inputs and outputs, or causes and effects.
As you can see in the chart, according to the 80/20 curve, the first 20% of the input would give you 80% output, but the remaining 80% of inputs would give you only 20% of the output.
Advantages and Disadvantages of the Pareto Principle
While the Pareto Principle can be a useful tool for making decisions and prioritizing tasks, it is important to remember that not all problems can be solved using this simple rule.
Relying too heavily on this approach could lead to unintended consequences such as neglecting some areas of need or over-investing in others. To make sure it is used effectively, it is important to consider both the advantages and disadvantages of the Pareto Principle before implementing it into any strategy or decision-making process.
The Advantages of the Pareto Principle
- The Pareto Principle allows decision-makers to focus their energy on the decisions that are most likely to produce the greatest results. This can save time and resources by eliminating the need to consider all options equally.
- Prioritization of efforts and resources can potentially lead to more efficient problem-solving.
- It helps decision-makers identify which areas of a project should receive greater attention and which can be addressed with less focus.
- By prioritizing results, the Pareto Principle encourages organizations to focus on quality over quantity when evaluating outcomes.
The Disadvantages of the Pareto Principle
- The Pareto Principle is based on a statistical model, which means it is not always accurate or reliable in predicting outcomes in real-world situations.
- In the Pareto analysis we "assume" that the current situation will remain static; changes in circumstances may require new strategies or decisions that cannot be predicted using given parameters.
- The principle only measures results, not effort; this can lead to a lack of incentives for employees or teams who put in extra effort but may not see their results represented in numbers or percentages.
- A focus on results can lead to tunnel vision and ignore potential long-term benefits or opportunities that may be available with different approaches or strategies; this could potentially limit innovation and creativity within an organization or team environment.
How to Find the 80/20 Using Spreadsheets?
Let's try to find the 80/20 distribution using a spreadsheet application like Microsoft Excel or Google Sheets.
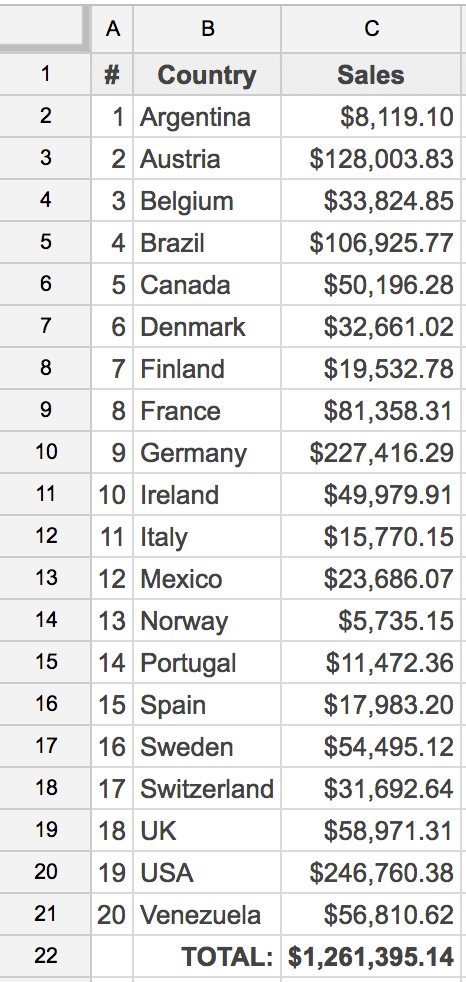
For the sake of this example, I will use Google Sheets to analyze sales data from the Northwind database. The Northwind database contains the sales data for a fictitious company called “Northwind Traders”.
Let's take a look at Northwind Trader’s total sales by country (open example Google Sheet here). I want to find out which countries attribute to 80% of total sales.
To do that you have to:
- Sort data by sales numbers in descending order.
- Calculate cumulative totals from top to bottom.
- Calculate the cumulative total percentage from total sales over all countries.
1. Sort Your Numbers
Before calculating cumulative totals, first, sort your data by the sales column in descending order. Make sure you sort ALL your columns by the sales column, not the sales column alone. Click here to see how to sort rows in MS Excel and how to sort rows in Google Sheets.
2. Calculate the Cumulative Total
The cumulative total simply means “how much so far”. To calculate cumulative totals we just have to add up the values as we go down the table row-by-row. Each cell should contain the sum of all sales numbers down to that cell.
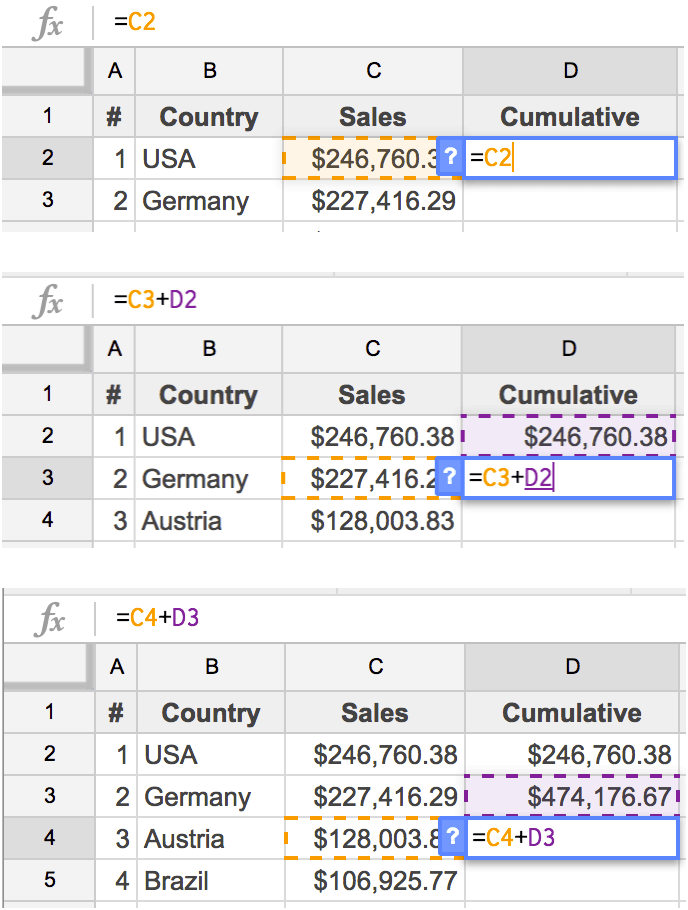
On the right you can see a simple formula I used to calculate cumulative totals:
- The first cell contains the same value as the sales number of the first row because that is equivalent to the total sales for the first row.
- All the other cells contain a sum of the current row sales plus the cumulative total of the previous cell.
You can use a formula like an example above: =C3+D2, where the C3 is the sales numbers for the current country, and D2 is the sum of previous sales numbers. In the next cell, the formula would be: =C4+D3, then =C5+D4, and so on.
3. Find the Cumulative Percentage
Finding cumulative percentages is quite simple. You have to divide the cumulative total in the current line by the total sales over all countries, and then format the number as a percentage.
As you can see in the example, the sales total is in column C, row 22.
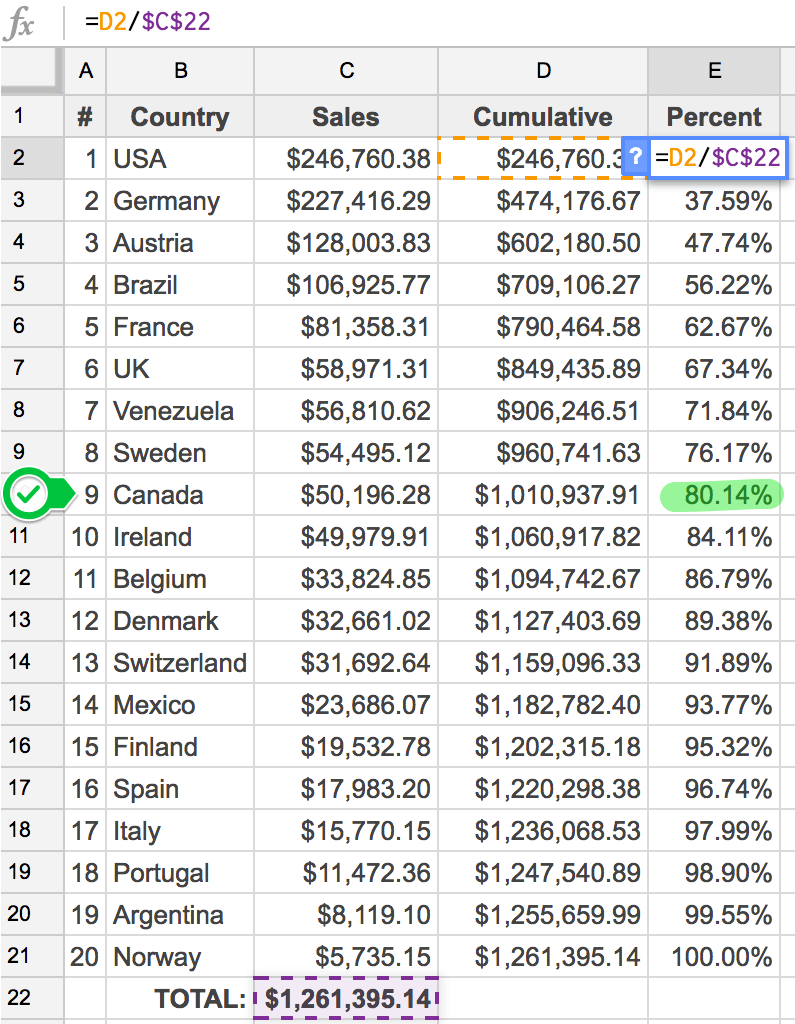
In the formula, I use the “$” symbol before column and row indicators in order to make this cell fixed both by column and by row. Now, if I copy this formula to any other cell, the D2 will be replaced with a different row number, but the $C$22 will not change.
As you can see in the table, the 80% cumulative threshold is reached at row 9, so the first 9 out of 20 countries (45%) are accountable for 80% of sales. In this example, it is an 80/45 relationship.
You might also notice that the top 3 countries (15%) are accountable for almost 50% of sales. It is a 50/15 relationship.
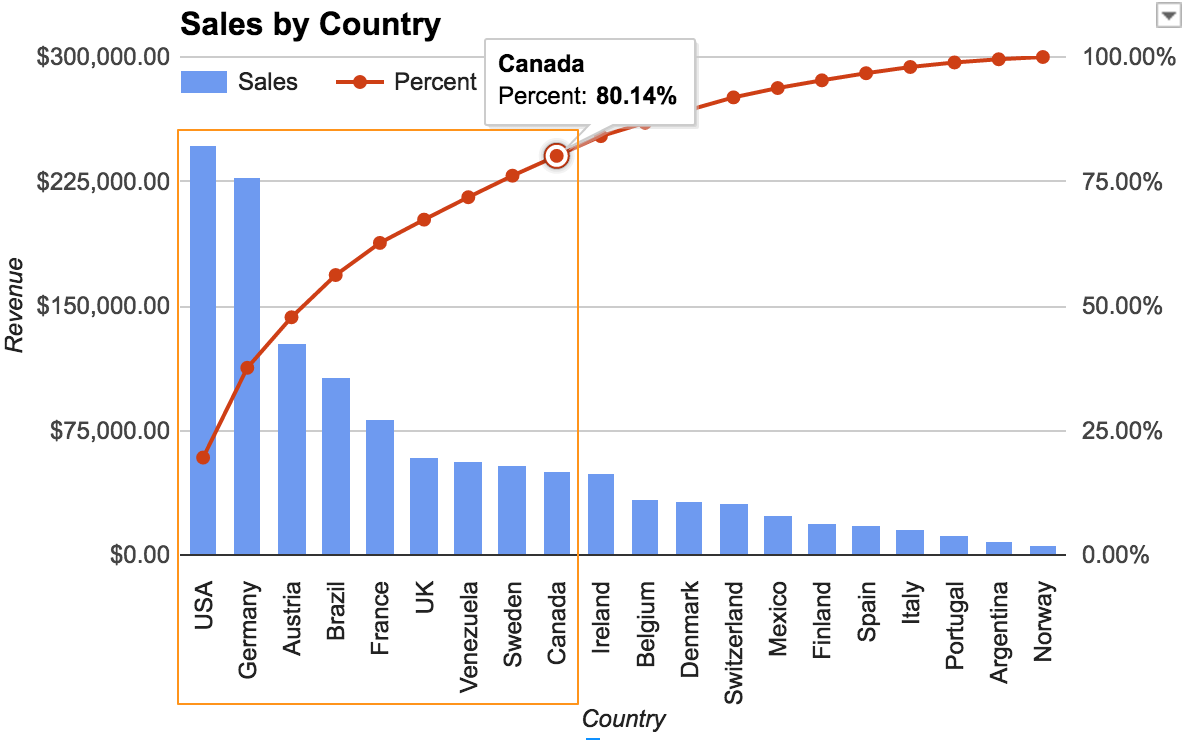
Sales by Country Chart
Let's plot sales and cumulative totals on a chart for better comprehension. As you can see, the cumulative totals line is a curve, similar to the 80/20 curve, only not as steep. It is because in this example we have an 80/40 relationship, not 80/20.
Finding the Vital Few Using eazyBI
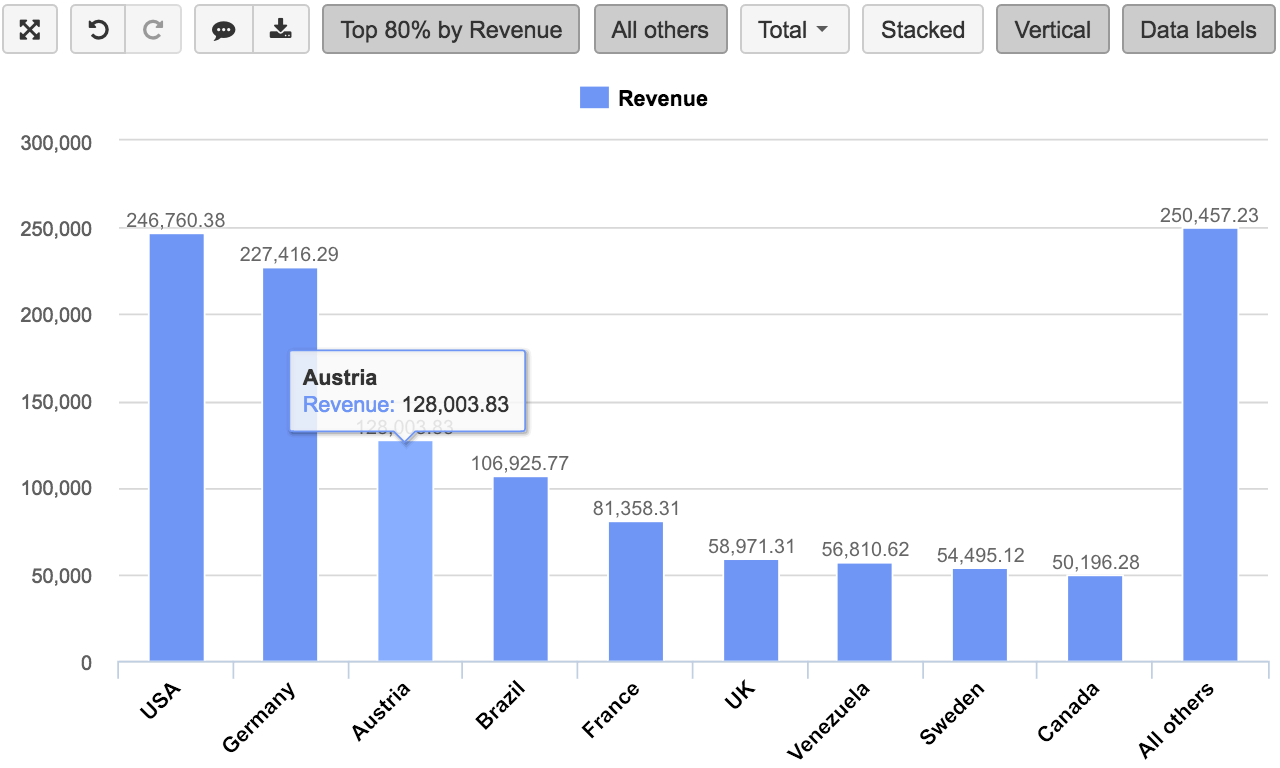
Finding the vital few with eazyBI is much simpler. To do that you just have to click on the legend, in this case, “Revenue”, and select the top 80% from the total.
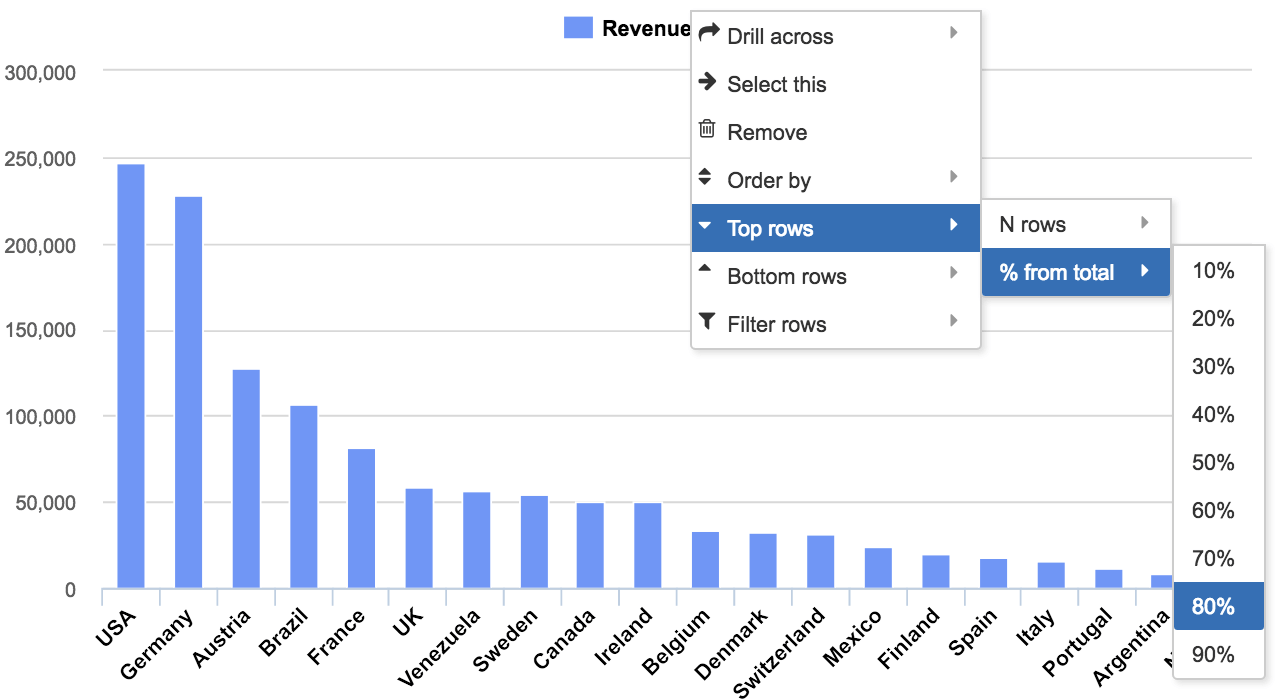
eazyBI does everything else automatically:
- Sorts the data in descending order.
- Calculates cumulative total.
- Filters out all the data that is below the threshold.
In the following chart, you can see the top 9 countries that contribute to 80% of the revenue. The last column combines all the remaining countries that were outside of the top 80%. Check the 80/20 sales report in eazyBI and feel free to experiment. To return to the previous view, refresh the page or click the “undo” arrow.
Conclusion
Pareto's law is a simple, yet very powerful tool. It can be applied to almost everything in business that you can count or measure:
- Which customers attribute to most of your income or profit?
- Which products are the most popular and why?
- Which software bugs cause the most crashes?
- Which employees attribute to most company sales?
- Which advertisement has the greatest effect and return on investment?
- What are your main customer sources?
- What are the most visited pages on your website?
- Who creates the most support tickets?
- Which activities take the most time?
- Which defects contribute to most guarantee requests?
Use it in your analysis, data discovery, planning, troubleshooting, problem-solving, decision-making, broad initial judgments, and when you need to check propositions.